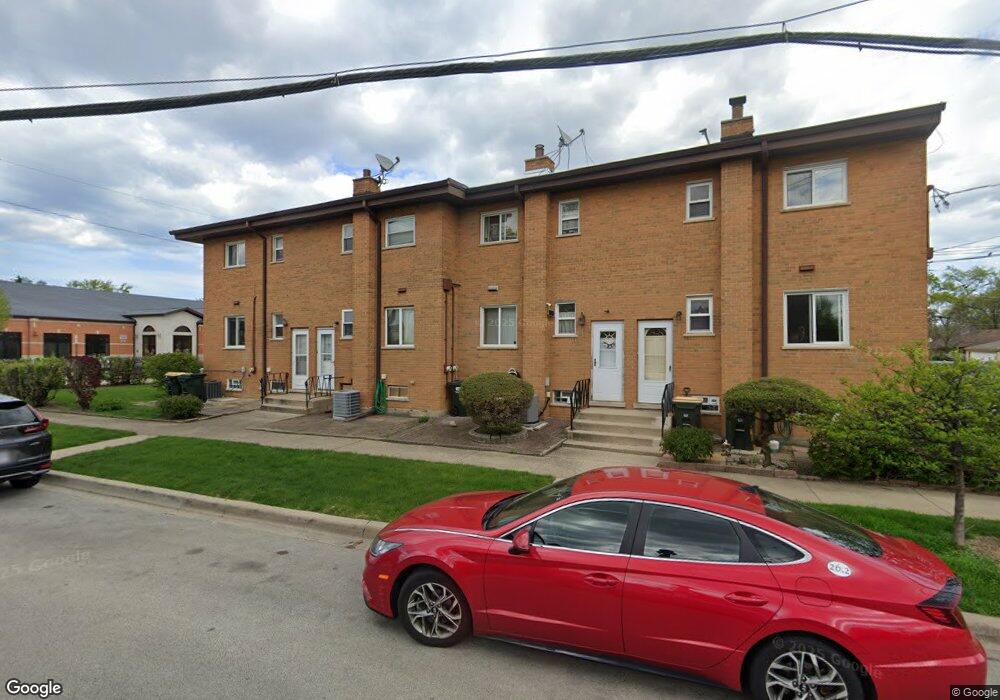
5851 Lincoln Ave Morton Grove, IL 60053
Estimated Value: $263,210 - $386,000
2
Beds
2
Baths
1,020
Sq Ft
$320/Sq Ft
Est. Value
About This Home
This home is located at 5851 Lincoln Ave, Morton Grove, IL 60053 and is currently estimated at $326,053, approximately $319 per square foot. 5851 Lincoln Ave is a home located in Cook County with nearby schools including Park View Elementary School, Niles West High School, and Arie Crown Hebrew Day School.
Ownership History
Date
Name
Owned For
Owner Type
Purchase Details
Closed on
Nov 17, 2004
Sold by
Choi Si Young and Choi Eun Young
Bought by
Ly Cuc N
Current Estimated Value
Home Financials for this Owner
Home Financials are based on the most recent Mortgage that was taken out on this home.
Original Mortgage
$155,000
Outstanding Balance
$76,989
Interest Rate
5.71%
Mortgage Type
Unknown
Estimated Equity
$249,064
Purchase Details
Closed on
Mar 11, 2002
Sold by
Tran Thanh M
Bought by
Choi Si Young and Choi Eun Young
Home Financials for this Owner
Home Financials are based on the most recent Mortgage that was taken out on this home.
Original Mortgage
$160,200
Interest Rate
6.93%
Mortgage Type
Balloon
Purchase Details
Closed on
Apr 15, 1999
Sold by
Castro Sara I
Bought by
Tran Thanh M
Home Financials for this Owner
Home Financials are based on the most recent Mortgage that was taken out on this home.
Original Mortgage
$130,130
Interest Rate
7.15%
Mortgage Type
FHA
Create a Home Valuation Report for This Property
The Home Valuation Report is an in-depth analysis detailing your home's value as well as a comparison with similar homes in the area
Home Values in the Area
Average Home Value in this Area
Purchase History
| Date | Buyer | Sale Price | Title Company |
|---|---|---|---|
| Ly Cuc N | $245,000 | Multiple | |
| Choi Si Young | $178,000 | Chicago Title Insurance Co | |
| Tran Thanh M | $131,000 | Professional National Title |
Source: Public Records
Mortgage History
| Date | Status | Borrower | Loan Amount |
|---|---|---|---|
| Open | Ly Cuc N | $155,000 | |
| Previous Owner | Choi Si Young | $160,200 | |
| Previous Owner | Tran Thanh M | $130,130 |
Source: Public Records
Tax History Compared to Growth
Tax History
| Year | Tax Paid | Tax Assessment Tax Assessment Total Assessment is a certain percentage of the fair market value that is determined by local assessors to be the total taxable value of land and additions on the property. | Land | Improvement |
|---|---|---|---|---|
| 2024 | $5,108 | $21,000 | $8,500 | $12,500 |
| 2023 | $4,838 | $21,000 | $8,500 | $12,500 |
| 2022 | $4,838 | $21,000 | $8,500 | $12,500 |
| 2021 | $4,439 | $17,169 | $696 | $16,473 |
| 2020 | $4,392 | $17,169 | $696 | $16,473 |
| 2019 | $4,441 | $19,292 | $696 | $18,596 |
| 2018 | $4,328 | $17,152 | $631 | $16,521 |
| 2017 | $4,380 | $17,152 | $631 | $16,521 |
| 2016 | $4,391 | $17,152 | $631 | $16,521 |
| 2015 | $3,373 | $13,090 | $544 | $12,546 |
| 2014 | $3,387 | $13,090 | $544 | $12,546 |
| 2013 | $3,953 | $15,197 | $544 | $14,653 |
Source: Public Records
Map
Nearby Homes
- 6035 Lincoln Ave
- 6140 Elm St
- 6166 Mayfair St Unit 33714
- 6163 Mayfair St Unit 102714
- 8306 Central Ave
- 8425 Callie Ave Unit 62
- 5510 Lincoln Ave Unit B301
- 5510 Lincoln Ave Unit B101
- 5506 Lincoln Ave Unit A117
- 5506 Lincoln Ave Unit A216
- 8300 Callie Ave Unit F314
- 8300 Callie Ave Unit F610
- 8400 Callie Ave Unit D209
- 8400 Callie Ave Unit D207
- 5501 Lincoln Ave Unit 203
- 8708 Central Ave
- 5500 Lincoln Ave Unit 407W
- 5500 Lincoln Ave Unit 116E
- 5500 Lincoln Ave Unit 109W
- 8836 Mansfield Ave
- 5851 Lincoln Ave
- 5851 Lincoln Ave
- 5851 Lincoln Ave
- 5851 Lincoln Ave Unit B
- 5847 Lincoln Ave
- 5847 Lincoln Ave
- 5847 Lincoln Ave
- 5847 Lincoln Ave
- 5847 Lincoln Ave Unit A
- 5847 Lincoln Ave Unit B
- 5847 Lincoln Ave Unit D
- 5847 Lincoln Ave Unit B
- 5843 Lincoln Ave Unit D
- 5843 Lincoln Ave
- 5843 Lincoln Ave
- 5843 Lincoln Ave
- 5843 Lincoln Ave
- 8429 Marmora Ave
- 5839 Lincoln Ave
- 5839 Lincoln Ave