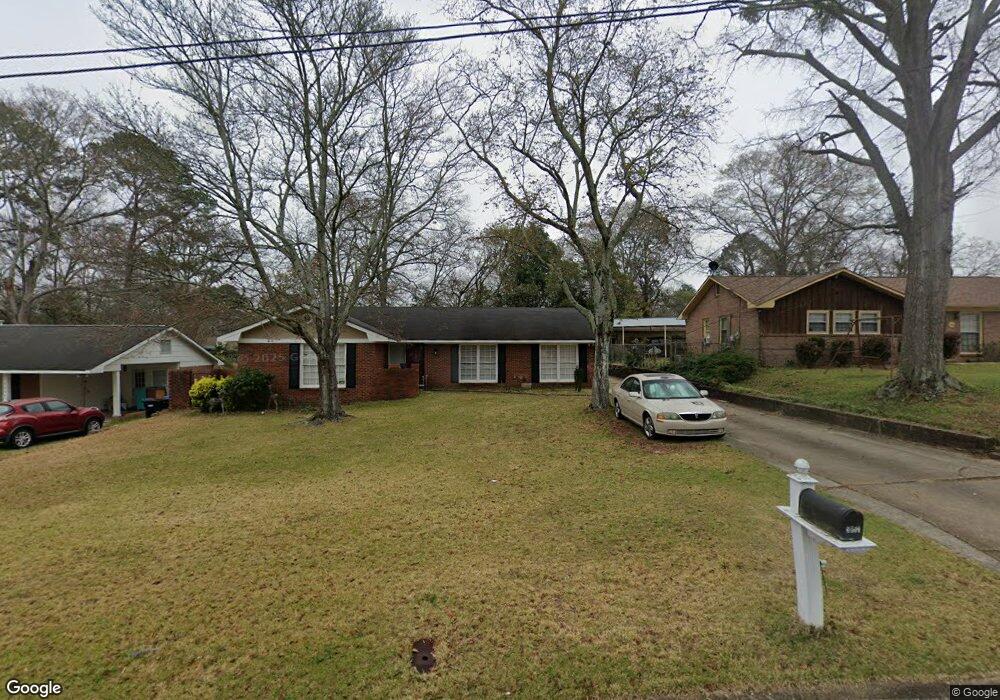
5852 Eula Ave Columbus, GA 31909
North Columbus NeighborhoodEstimated Value: $208,656 - $264,000
3
Beds
3
Baths
1,675
Sq Ft
$137/Sq Ft
Est. Value
About This Home
This home is located at 5852 Eula Ave, Columbus, GA 31909 and is currently estimated at $228,664, approximately $136 per square foot. 5852 Eula Ave is a home located in Muscogee County with nearby schools including Gentian Elementary School, Midland Middle School, and Hardaway High School.
Ownership History
Date
Name
Owned For
Owner Type
Purchase Details
Closed on
May 10, 2017
Sold by
Mimbs Kelly J
Bought by
Williams Falichia
Current Estimated Value
Home Financials for this Owner
Home Financials are based on the most recent Mortgage that was taken out on this home.
Original Mortgage
$141,988
Outstanding Balance
$116,877
Interest Rate
4.08%
Mortgage Type
VA
Estimated Equity
$111,787
Purchase Details
Closed on
Nov 25, 2013
Sold by
Hudson Patrick
Bought by
Mimbs Kelly J
Home Financials for this Owner
Home Financials are based on the most recent Mortgage that was taken out on this home.
Original Mortgage
$116,100
Interest Rate
4.16%
Mortgage Type
New Conventional
Purchase Details
Closed on
Jun 21, 2013
Sold by
Federal National Mortgage Association
Bought by
Hudson Patrick
Purchase Details
Closed on
Feb 5, 2013
Sold by
Jpmorgan Chase Bank Nation
Bought by
Federal National Mtg Associati
Create a Home Valuation Report for This Property
The Home Valuation Report is an in-depth analysis detailing your home's value as well as a comparison with similar homes in the area
Home Values in the Area
Average Home Value in this Area
Purchase History
| Date | Buyer | Sale Price | Title Company |
|---|---|---|---|
| Williams Falichia | $139,000 | -- | |
| Mimbs Kelly J | $129,000 | -- | |
| Hudson Patrick | $65,000 | -- | |
| Federal National Mtg Associati | $114,921 | -- | |
| Jpmorgan Chase Bank National A | $114,921 | -- |
Source: Public Records
Mortgage History
| Date | Status | Borrower | Loan Amount |
|---|---|---|---|
| Open | Williams Falichia | $141,988 | |
| Previous Owner | Mimbs Kelly J | $116,100 |
Source: Public Records
Tax History
| Year | Tax Paid | Tax Assessment Tax Assessment Total Assessment is a certain percentage of the fair market value that is determined by local assessors to be the total taxable value of land and additions on the property. | Land | Improvement |
|---|---|---|---|---|
| 2025 | $2,701 | $68,996 | $13,784 | $55,212 |
| 2024 | $2,701 | $68,996 | $13,784 | $55,212 |
| 2023 | $2,718 | $68,996 | $13,784 | $55,212 |
| 2022 | $2,354 | $57,644 | $13,784 | $43,860 |
| 2021 | $2,359 | $57,776 | $13,784 | $43,992 |
| 2020 | $2,360 | $57,776 | $13,784 | $43,992 |
| 2019 | $2,367 | $57,776 | $13,784 | $43,992 |
| 2018 | $2,278 | $55,600 | $13,120 | $42,480 |
| 2017 | $522 | $58,240 | $13,784 | $44,456 |
| 2016 | $525 | $51,600 | $3,300 | $48,300 |
| 2015 | $528 | $51,600 | $3,300 | $48,300 |
| 2014 | $527 | $26,000 | $3,300 | $22,700 |
| 2013 | -- | $58,794 | $3,300 | $55,494 |
Source: Public Records
Map
Nearby Homes
- 5829 Moon Rd
- 5823 Pratt Ave
- 4320 Canady St
- 4437 Ansley Ave
- 5820 Windsor Dr
- 5224 Miller Rd
- 5926 Frazier Dr
- 6104 Windsor Dr
- 6158 Arrington Dr
- 4202 Cheshire Bridge Rd
- 4001 Twilight Dr
- 4465 Weems Rd
- 2 Biltmore Ct
- 4847 Warm Springs Rd
- 6002 Canterbury Dr
- 5921 Canterbury Dr
- 6411 Michael Ave
- 5836 Sherborne Dr
- 3845 Arrel Dr
- 6016 Warm Springs Ct
Your Personal Tour Guide
Ask me questions while you tour the home.