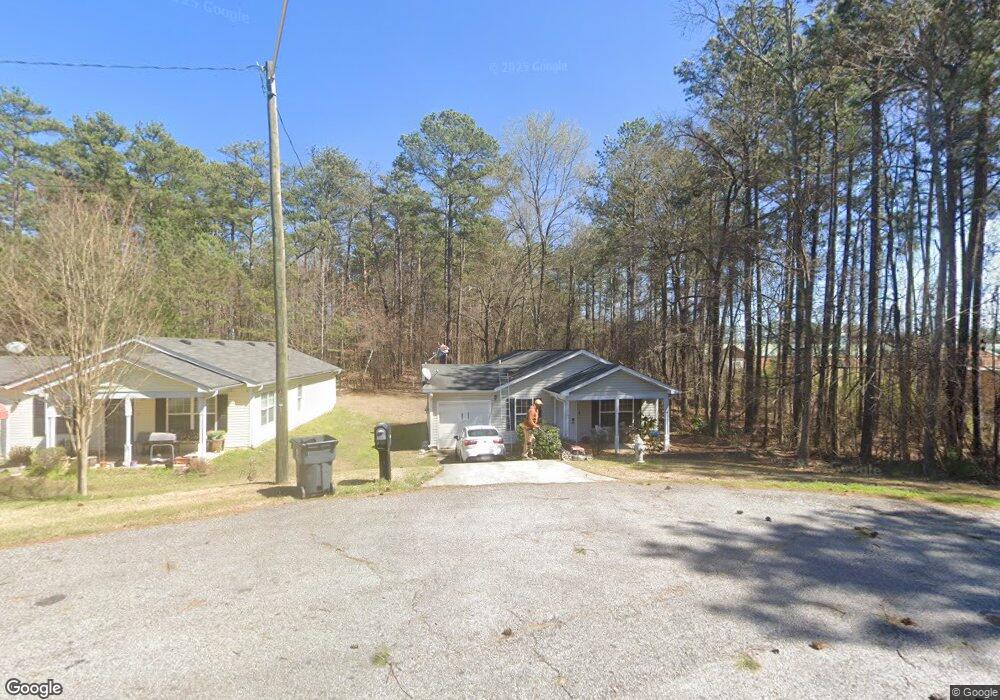
5852 Lillian Ln Morrow, GA 30260
Estimated Value: $230,000 - $235,381
3
Beds
2
Baths
1,350
Sq Ft
$173/Sq Ft
Est. Value
About This Home
This home is located at 5852 Lillian Ln, Morrow, GA 30260 and is currently estimated at $233,095, approximately $172 per square foot. 5852 Lillian Ln is a home located in Clayton County with nearby schools including Thurgood Marshall Elementary School, Morrow Middle School, and Morrow High School.
Ownership History
Date
Name
Owned For
Owner Type
Purchase Details
Closed on
Sep 13, 2013
Sold by
Southern Crescent Habitat
Bought by
Cook Ashley
Current Estimated Value
Home Financials for this Owner
Home Financials are based on the most recent Mortgage that was taken out on this home.
Original Mortgage
$56,085
Outstanding Balance
$41,323
Interest Rate
4.39%
Mortgage Type
New Conventional
Estimated Equity
$191,772
Purchase Details
Closed on
Mar 1, 2011
Sold by
Thomas Mekia S
Bought by
Southern Crescent Habitat Of H
Purchase Details
Closed on
Dec 29, 2008
Sold by
Southern Crescent Habitat Of H
Bought by
Thomas Mekia S
Home Financials for this Owner
Home Financials are based on the most recent Mortgage that was taken out on this home.
Original Mortgage
$45,079
Interest Rate
5.95%
Mortgage Type
New Conventional
Purchase Details
Closed on
Nov 27, 2006
Sold by
Southern Crescent Habitat Huma
Bought by
Silva Rebecca P
Home Financials for this Owner
Home Financials are based on the most recent Mortgage that was taken out on this home.
Original Mortgage
$47,000
Interest Rate
6.36%
Mortgage Type
New Conventional
Create a Home Valuation Report for This Property
The Home Valuation Report is an in-depth analysis detailing your home's value as well as a comparison with similar homes in the area
Home Values in the Area
Average Home Value in this Area
Purchase History
| Date | Buyer | Sale Price | Title Company |
|---|---|---|---|
| Cook Ashley | $74,605 | -- | |
| Southern Crescent Habitat Of H | $116,769 | -- | |
| Thomas Mekia S | $122,000 | -- | |
| Silva Rebecca P | $122,000 | -- |
Source: Public Records
Mortgage History
| Date | Status | Borrower | Loan Amount |
|---|---|---|---|
| Open | Cook Ashley | $56,085 | |
| Closed | Cook Ashley | $16,520 | |
| Previous Owner | Thomas Mekia S | $45,079 | |
| Previous Owner | Silva Rebecca P | $47,000 |
Source: Public Records
Tax History
| Year | Tax Paid | Tax Assessment Tax Assessment Total Assessment is a certain percentage of the fair market value that is determined by local assessors to be the total taxable value of land and additions on the property. | Land | Improvement |
|---|---|---|---|---|
| 2025 | $3,811 | $98,600 | $2,000 | $96,600 |
| 2024 | $3,741 | $95,000 | $2,000 | $93,000 |
| 2023 | $3,202 | $88,680 | $2,000 | $86,680 |
| 2022 | $2,437 | $61,200 | $2,000 | $59,200 |
| 2021 | $1,645 | $40,760 | $2,000 | $38,760 |
| 2020 | $1,566 | $38,273 | $2,000 | $36,273 |
| 2019 | $1,463 | $35,165 | $1,800 | $33,365 |
| 2018 | $1,313 | $31,470 | $1,800 | $29,670 |
| 2017 | $1,258 | $30,058 | $1,800 | $28,258 |
| 2016 | $1,241 | $29,636 | $1,800 | $27,836 |
| 2015 | $1,232 | $0 | $0 | $0 |
| 2014 | $1,143 | $27,868 | $1,800 | $26,068 |
Source: Public Records
Map
Nearby Homes
- 0 Thompson Blvd
- 0 Denson Blvd Unit 1527338
- 2272 Santa fe St Unit 21
- 5712 Attucks Blvd
- 2276 Santa fe St Unit 19
- 2316 Santa fe St Unit 5
- 2271 Santa fe St Unit 23
- 5651 Handley Blvd
- 0 Carriage Dr Unit 10652198
- 0 Carriage Dr Unit 7688037
- 0 Maddox Rd Unit 10674000
- 0 Maddox Rd Unit 183163
- 2144 Carriage Dr
- 2382 Old Rex Morrow Rd
- 2313 Poplar Ave
- 2391 Prestige Valley Ct
- 6070 Danbury Ct
- LOT 39 Herndon Blvd
- LOT 26,27,28 Herndon Blvd
- 0 Herndon Blvd Unit 7730551
- 5846 Lillian Ln
- 5840 Lillian Ln
- 5834 Lillian Ln
- 5828 Lillian Ln
- 5846 Trammell Rd
- 5822 Lillian Ln
- 5836 Trammell Rd
- 5838 Trammell Rd
- 5816 Lillian Ln
- 5818 Thompson Blvd
- 5824 Trammell Rd
- 5810 Lillian Ln
- 5824 Thompson Blvd
- 5826 Trammell Rd
- 5812 Trammell Rd
- 0 Lillian Ln
- 5812 Thompson Blvd
- 5816 Thompson Blvd
- 5795 Thompson Blvd
- 5800 Trammell Rd Unit 5802
Your Personal Tour Guide
Ask me questions while you tour the home.