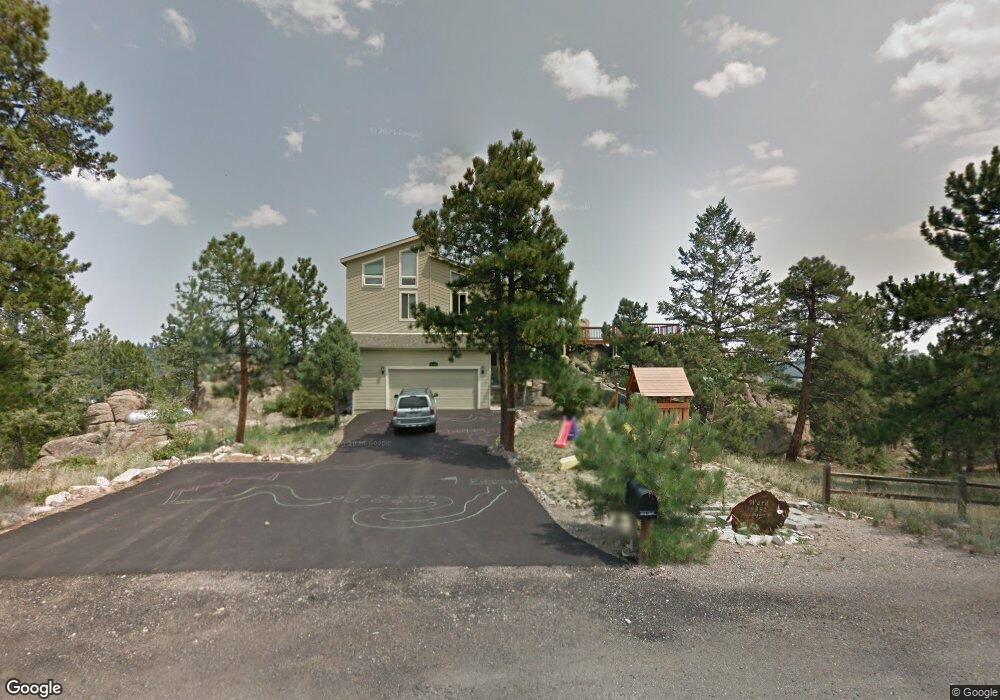
5852 S Langdon Dr Evergreen, CO 80439
North Turkey Creek NeighborhoodEstimated Value: $1,106,000 - $1,230,000
4
Beds
3
Baths
2,864
Sq Ft
$411/Sq Ft
Est. Value
About This Home
This home is located at 5852 S Langdon Dr, Evergreen, CO 80439 and is currently estimated at $1,175,914, approximately $410 per square foot. 5852 S Langdon Dr is a home located in Jefferson County with nearby schools including Wilmot Elementary School, Evergreen Middle School, and Evergreen High School.
Ownership History
Date
Name
Owned For
Owner Type
Purchase Details
Closed on
May 8, 2020
Sold by
Ward Ty L
Bought by
Mintz Jonathan A and Peterson Valerie L
Current Estimated Value
Home Financials for this Owner
Home Financials are based on the most recent Mortgage that was taken out on this home.
Original Mortgage
$510,400
Outstanding Balance
$453,971
Interest Rate
3.5%
Mortgage Type
New Conventional
Estimated Equity
$721,943
Purchase Details
Closed on
Jul 23, 2018
Sold by
Ward Tv L and Ward Ashley N
Bought by
Ward Tv L
Home Financials for this Owner
Home Financials are based on the most recent Mortgage that was taken out on this home.
Original Mortgage
$263,500
Interest Rate
4.6%
Mortgage Type
New Conventional
Purchase Details
Closed on
Feb 6, 2009
Sold by
Ward Ty L and Hill Ashley N
Bought by
Ward Ty L and Ward Ashley N
Home Financials for this Owner
Home Financials are based on the most recent Mortgage that was taken out on this home.
Original Mortgage
$309,000
Interest Rate
5.06%
Mortgage Type
New Conventional
Create a Home Valuation Report for This Property
The Home Valuation Report is an in-depth analysis detailing your home's value as well as a comparison with similar homes in the area
Home Values in the Area
Average Home Value in this Area
Purchase History
| Date | Buyer | Sale Price | Title Company |
|---|---|---|---|
| Mintz Jonathan A | $750,000 | Chicago Title | |
| Ward Tv L | -- | Land Title Guarantee | |
| Ward Ty L | -- | None Available |
Source: Public Records
Mortgage History
| Date | Status | Borrower | Loan Amount |
|---|---|---|---|
| Open | Mintz Jonathan A | $510,400 | |
| Previous Owner | Ward Tv L | $263,500 | |
| Previous Owner | Ward Ty L | $309,000 |
Source: Public Records
Tax History Compared to Growth
Tax History
| Year | Tax Paid | Tax Assessment Tax Assessment Total Assessment is a certain percentage of the fair market value that is determined by local assessors to be the total taxable value of land and additions on the property. | Land | Improvement |
|---|---|---|---|---|
| 2024 | $6,263 | $68,295 | $16,078 | $52,217 |
| 2023 | $6,263 | $68,295 | $16,078 | $52,217 |
| 2022 | $4,925 | $52,125 | $11,978 | $40,147 |
| 2021 | $4,975 | $53,625 | $12,323 | $41,302 |
| 2020 | $3,966 | $42,412 | $9,565 | $32,847 |
| 2019 | $3,910 | $42,412 | $9,565 | $32,847 |
| 2018 | $3,867 | $40,570 | $10,376 | $30,194 |
| 2017 | $3,521 | $40,570 | $10,376 | $30,194 |
| 2016 | $3,399 | $36,600 | $9,655 | $26,945 |
| 2015 | $3,100 | $36,600 | $9,655 | $26,945 |
| 2014 | $3,100 | $32,383 | $11,098 | $21,285 |
Source: Public Records
Map
Nearby Homes
- 5720 Northwood Dr
- 25925 Lost Cabin Trail Unit 39-43
- 5525 S Twin Spruce Dr
- 25728 Stanley Park Rd
- 25187 Stanley Park Rd
- 5825 High Dr
- 26130 Edelweiss Cir
- 6187 Stone Creek Dr
- 6519 Jungfrau Way
- 5237 Bear Mountain Dr
- 5197 Bear Mountain Dr
- 5939 Lone Peak Dr
- 5236 Bear Mountain Dr
- 5925 Herzman Dr
- 25553 Mountain Moss Ct
- 26978 Mesa Dr
- 5166 Bear Mountain Dr
- 5166 Bear Mountain Dr Unit 1
- 0 Fern Gulch Unit REC6395499
- 6371 Canyon Creek Rd Unit 12
- 5853 S Langdon Dr
- 5793 S Langdon Dr
- 5851 Northwood Dr
- 5901 Northwood Dr
- 5903 S Langdon Dr
- 5741 Northwood Dr
- 5891 Northwood Dr
- 5750 Northwood Dr
- 5790 Northwood Dr
- 5921 Northwood Dr
- 5800 Northwood Dr
- 5735 Northwood Dr
- 5761 Northwood Dr
- 0 Northwood Dr
- 5920 Northwood Dr
- 5890 Northwood Dr
- 5850 Northwood Dr
- 5833 S Langdon Dr
- 5860 Northwood Dr
- 5731 Northwood Dr