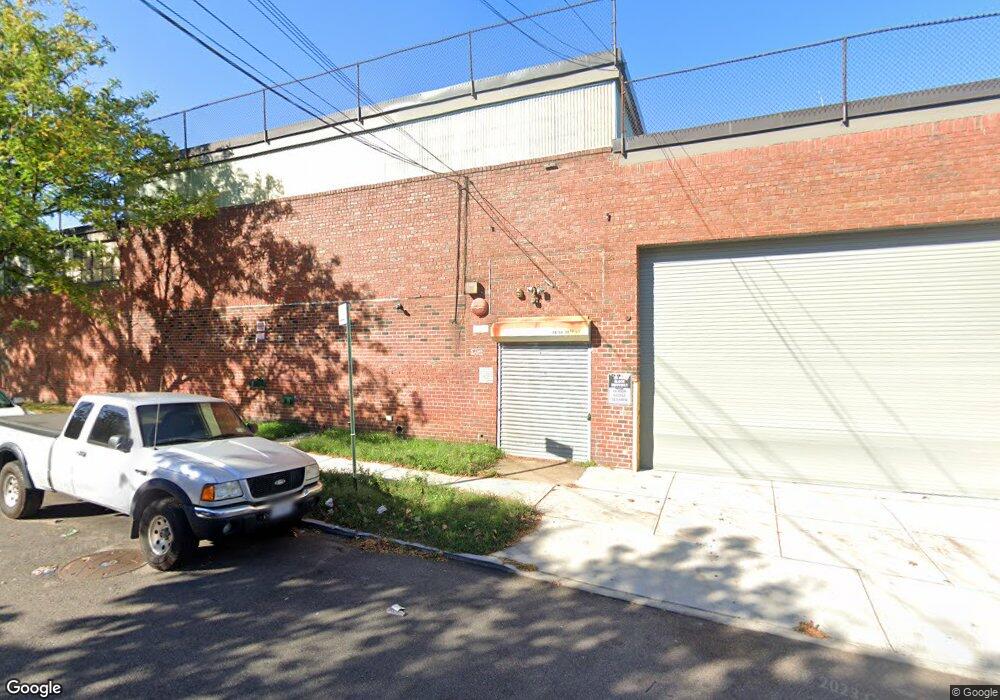
5854 59th St Flushing, NY 11378
Maspeth Neighborhood
Studio
--
Bath
62,102
Sq Ft
48,831
Sq Ft Lot
About This Home
This home is located at 5854 59th St, Flushing, NY 11378. 5854 59th St is a home located in Queens County with nearby schools including I.S. 093 Ridgewood, Grover Cleveland High School, and The Renaissance Charter School 2.
Ownership History
Date
Name
Owned For
Owner Type
Purchase Details
Closed on
Oct 22, 2008
Sold by
Am-T Holdings Llc and % The Mack Company
Bought by
M-H Realty Co #6 Llc
Home Financials for this Owner
Home Financials are based on the most recent Mortgage that was taken out on this home.
Original Mortgage
$1,925,000
Interest Rate
6.08%
Mortgage Type
Commercial
Purchase Details
Closed on
Jun 30, 1993
Sold by
Heiferman Solomon and Mack Hyman B
Bought by
Mack William and Mack David
Create a Home Valuation Report for This Property
The Home Valuation Report is an in-depth analysis detailing your home's value as well as a comparison with similar homes in the area
Home Values in the Area
Average Home Value in this Area
Purchase History
| Date | Buyer | Sale Price | Title Company |
|---|---|---|---|
| M-H Realty Co #6 Llc | -- | -- | |
| Mack William | -- | -- | |
| Heiferman Solomon | -- | The Title Guarantee Company | |
| Heiferman Solomon | -- | -- | |
| Mack William | -- | The Title Guarantee Company |
Source: Public Records
Mortgage History
| Date | Status | Borrower | Loan Amount |
|---|---|---|---|
| Previous Owner | M-H Realty Co #6 Llc | $1,925,000 |
Source: Public Records
Tax History
| Year | Tax Paid | Tax Assessment Tax Assessment Total Assessment is a certain percentage of the fair market value that is determined by local assessors to be the total taxable value of land and additions on the property. | Land | Improvement |
|---|---|---|---|---|
| 2025 | $234,459 | $2,279,160 | $549,000 | $1,730,160 |
| 2024 | $234,459 | $2,213,550 | $549,000 | $1,664,550 |
| 2023 | $228,634 | $2,158,550 | $549,000 | $1,609,550 |
| 2022 | $226,597 | $2,299,500 | $549,000 | $1,750,500 |
| 2021 | $188,353 | $1,761,300 | $549,000 | $1,212,300 |
| 2020 | $218,923 | $2,198,700 | $549,000 | $1,649,700 |
| 2019 | $215,456 | $2,471,850 | $549,000 | $1,922,850 |
| 2018 | $204,913 | $1,948,950 | $439,200 | $1,509,750 |
| 2017 | $190,479 | $1,811,670 | $439,200 | $1,372,470 |
| 2016 | $183,233 | $1,811,670 | $439,200 | $1,372,470 |
| 2015 | $73,897 | $1,657,760 | $439,200 | $1,218,560 |
| 2014 | $73,897 | $1,669,570 | $439,200 | $1,230,370 |
Source: Public Records
Map
Nearby Homes
- 5912 58th Rd
- 5801 59th St
- 59-17 58th Ave
- 5940 Flushing Ave
- 58-22 60th Place
- 6060 Flushing Ave
- 57-37 59th St
- 58-29 60th Ln
- 5907 59th Dr
- 5814 58th Ave
- 60-15 Maspeth Ave
- 5949 56th Dr
- 61-38 Grand Ave
- 56-57 61st St
- 5807 Maspeth Ave
- 60-14 60th Ave
- 57-22 63rd St
- 61-22 56th Dr
- 5974 Fresh Pond Rd
- 6014 56th Ave
Your Personal Tour Guide
Ask me questions while you tour the home.