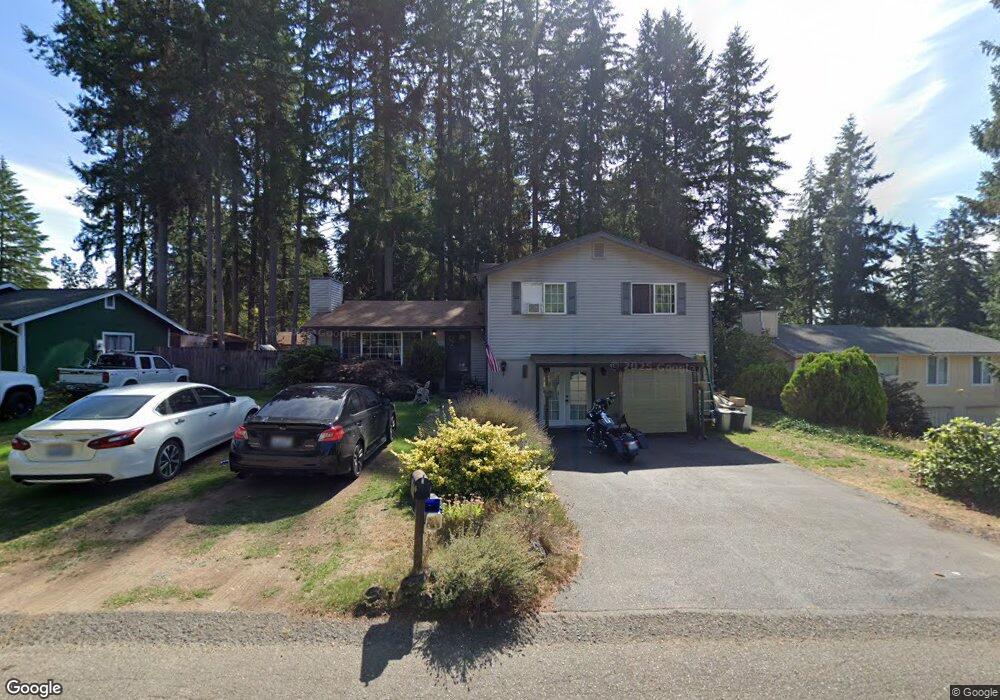
5854 SE Pennswood Ct Port Orchard, WA 98367
Bethel NeighborhoodEstimated Value: $489,299 - $532,000
3
Beds
3
Baths
1,300
Sq Ft
$390/Sq Ft
Est. Value
About This Home
This home is located at 5854 SE Pennswood Ct, Port Orchard, WA 98367 and is currently estimated at $506,825, approximately $389 per square foot. 5854 SE Pennswood Ct is a home located in Kitsap County with nearby schools including Hidden Creek Elementary School, Marcus Whitman Middle School, and South Kitsap High School.
Ownership History
Date
Name
Owned For
Owner Type
Purchase Details
Closed on
Dec 4, 2009
Sold by
Sala Heather
Bought by
Sala Ernest
Current Estimated Value
Purchase Details
Closed on
Mar 7, 2002
Sold by
Dumpert Chad M and Dumpert Jennifer S
Bought by
Sala Ernesto and Sala Heather M
Home Financials for this Owner
Home Financials are based on the most recent Mortgage that was taken out on this home.
Original Mortgage
$115,200
Outstanding Balance
$53,339
Interest Rate
8.62%
Estimated Equity
$453,486
Purchase Details
Closed on
May 24, 1999
Sold by
Forcier Robert L and Forcier Martha I
Bought by
Dumpert Chad M and Dumpert Jennifer S
Home Financials for this Owner
Home Financials are based on the most recent Mortgage that was taken out on this home.
Original Mortgage
$124,440
Interest Rate
6.86%
Mortgage Type
VA
Create a Home Valuation Report for This Property
The Home Valuation Report is an in-depth analysis detailing your home's value as well as a comparison with similar homes in the area
Home Values in the Area
Average Home Value in this Area
Purchase History
| Date | Buyer | Sale Price | Title Company |
|---|---|---|---|
| Sala Ernest | -- | None Available | |
| Sala Ernesto | $144,000 | Transnation Title Ins Co | |
| Dumpert Chad M | $122,000 | Transnation Title Insurance |
Source: Public Records
Mortgage History
| Date | Status | Borrower | Loan Amount |
|---|---|---|---|
| Open | Sala Ernesto | $115,200 | |
| Previous Owner | Dumpert Chad M | $124,440 | |
| Closed | Sala Ernesto | $28,800 |
Source: Public Records
Tax History Compared to Growth
Tax History
| Year | Tax Paid | Tax Assessment Tax Assessment Total Assessment is a certain percentage of the fair market value that is determined by local assessors to be the total taxable value of land and additions on the property. | Land | Improvement |
|---|---|---|---|---|
| 2026 | $3,380 | $380,700 | $75,600 | $305,100 |
| 2025 | $3,380 | $381,970 | $63,600 | $318,370 |
| 2024 | $3,278 | $381,970 | $63,600 | $318,370 |
| 2023 | $3,256 | $381,970 | $63,600 | $318,370 |
| 2022 | $3,203 | $315,000 | $59,390 | $255,610 |
| 2021 | $2,763 | $255,980 | $55,190 | $200,790 |
| 2020 | $2,711 | $244,110 | $52,560 | $191,550 |
| 2019 | $2,059 | $201,730 | $52,110 | $149,620 |
| 2018 | $2,172 | $166,020 | $52,110 | $113,910 |
| 2017 | $1,866 | $166,020 | $52,110 | $113,910 |
| 2016 | $1,836 | $149,610 | $52,110 | $97,500 |
| 2015 | $1,788 | $147,680 | $52,110 | $95,570 |
| 2014 | -- | $145,740 | $52,110 | $93,630 |
| 2013 | -- | $161,310 | $54,860 | $106,450 |
Source: Public Records
Map
Nearby Homes
- 5673 Bethel Rd SE Unit 28
- 1577 SE Oregon St
- 2430 SE Celebrity Ct
- 0 SE Bethel Rd Unit NWM2437882
- 2426 SE Celebrity Ct
- 5230 Bethel Rd SE
- 5184 Granada Place SE
- 5 XXX Ferate Ave SE
- 0 SE Sedgwick Rd Unit NWM2362855
- 0 SE Sedgwick Rd Unit 21804061
- 0 SE Sedgwick Rd Unit NWM2332354
- 4777 Okanogan Dr SE
- 6146 Windlass Ave SE
- 1612 SE Sylvis Ln
- 6830 Arlington Place SE
- 1073 Sedgewick
- 1116 Koda Cir SE
- 4590 Laguna Ln SE
- 1164 Koda Cir SE
- 0 Geiger Rd SE
- 5858 SE Pennswood Ct
- 2105 Hillwood Ln SE
- 5862 SE Pennswood Ct
- 2135 Hillwood Ln SE
- 5848 SE Pennswood Ct
- 2095 Hillwood Ln SE
- 5835 SE Pennswood Ct
- 5825 SE Pennswood Ct
- 2175 Hillwood Ln SE
- 5866 SE Pennswood Ct
- 5821 SE Pennswood Ct
- 2065 Hillwood Ln SE
- 5841 SE Pennswood Ct
- 5839 SE Pennswood Ct
- 2120 Hillwood Ln SE
- 2100 Hillwood Ln SE
- 5872 SE Pennswood Ct
- 5817 SE Pennswood Ct