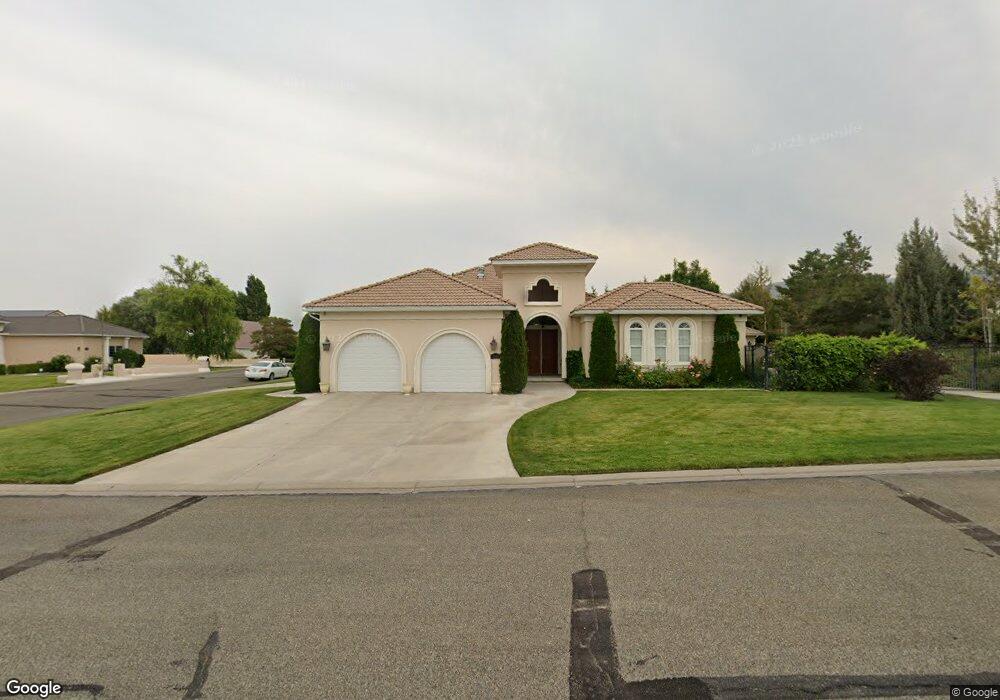
5855 Brooke Dr Winnemucca, NV 89445
Estimated Value: $754,000 - $970,000
2
Beds
3
Baths
2,971
Sq Ft
$280/Sq Ft
Est. Value
About This Home
This home is located at 5855 Brooke Dr, Winnemucca, NV 89445 and is currently estimated at $832,384, approximately $280 per square foot. 5855 Brooke Dr is a home located in Humboldt County with nearby schools including Sonoma Heights Elementary School, French Ford Middle School, and Winnemucca Junior High School.
Ownership History
Date
Name
Owned For
Owner Type
Purchase Details
Closed on
Jun 14, 2016
Sold by
Weichert Workforce Mobility Inc
Bought by
Gray J Patrick and Gray Demarah B
Current Estimated Value
Home Financials for this Owner
Home Financials are based on the most recent Mortgage that was taken out on this home.
Original Mortgage
$336,000
Outstanding Balance
$267,305
Interest Rate
3.64%
Mortgage Type
New Conventional
Estimated Equity
$565,079
Purchase Details
Closed on
Apr 12, 2016
Sold by
Fein Matthew R and Fein Kim M
Bought by
Weichert Workforce Mobility Inc
Purchase Details
Closed on
Apr 23, 2013
Sold by
Fransway John T and Fransway Ria
Bought by
Fein Matthew R and Fein Kim M
Home Financials for this Owner
Home Financials are based on the most recent Mortgage that was taken out on this home.
Original Mortgage
$352,000
Interest Rate
3.54%
Mortgage Type
New Conventional
Create a Home Valuation Report for This Property
The Home Valuation Report is an in-depth analysis detailing your home's value as well as a comparison with similar homes in the area
Home Values in the Area
Average Home Value in this Area
Purchase History
| Date | Buyer | Sale Price | Title Company |
|---|---|---|---|
| Gray J Patrick | $420,000 | Western Title Company Inc | |
| Weichert Workforce Mobility Inc | $420,000 | Western Title Company Inc | |
| Fein Matthew R | $440,000 | Western Title Company |
Source: Public Records
Mortgage History
| Date | Status | Borrower | Loan Amount |
|---|---|---|---|
| Open | Gray J Patrick | $336,000 | |
| Previous Owner | Fein Matthew R | $352,000 |
Source: Public Records
Tax History Compared to Growth
Tax History
| Year | Tax Paid | Tax Assessment Tax Assessment Total Assessment is a certain percentage of the fair market value that is determined by local assessors to be the total taxable value of land and additions on the property. | Land | Improvement |
|---|---|---|---|---|
| 2025 | $7,441 | $240,516 | $20,475 | $220,041 |
| 2024 | $7,039 | $241,386 | $20,475 | $220,910 |
| 2023 | $7,039 | $226,604 | $19,775 | $206,829 |
| 2022 | $6,050 | $187,346 | $19,775 | $167,571 |
| 2021 | $5,975 | $185,743 | $19,775 | $165,968 |
| 2020 | $5,804 | $188,942 | $19,775 | $169,167 |
| 2019 | $4,915 | $160,748 | $19,775 | $140,973 |
| 2018 | $4,775 | $154,582 | $17,675 | $136,907 |
| 2017 | $4,639 | $142,874 | $17,675 | $125,199 |
| 2016 | $4,719 | $144,995 | $17,675 | $127,320 |
| 2015 | $4,654 | $157,471 | $17,675 | $139,796 |
| 2014 | $4,654 | $153,905 | $17,675 | $136,230 |
Source: Public Records
Map
Nearby Homes
- 5550 Patrician Way
- 5890 Cross Creek
- 2 Routson Park Ln
- 4103 Broken Hill Rd
- 4107 Two Rock Dr
- 4100 Two Rock Dr
- 5320 Marla Dr Unit 19
- 5310 Marla Dr Unit 18
- 5280 Marla Dr Unit 15
- 5305 Marla Dr Unit 5
- 5295 Marla Dr Unit 4
- 5285 Marla Dr Unit 3
- Lot 16059313 Offenhauser Dr
- Lot 16059212 Offenhauser Dr
- Lot 16059312 Offenhauser Dr
- Lot 16059303 Offenhauser Dr
- Lot 16059209 Offenhauser Dr
- Lot 16059301 Offenhauser Dr
- Lot 16059211 Offenhauser Dr
- Lot 16059305 Offenhauser Dr
- 5865 Brooke Dr
- 5540 Patrician Way
- 5520 Patrician Way
- 5525 Patrician Way
- 5860 Brooke Dr
- 5870 Brooke Dr
- 5515 Patrician Way
- 5885 Brooke Dr
- 5590 Patrician Way
- 5510 Patrician Way
- 5535 Patrician Way
- 5535 Patrician Way Unit 1
- 5555 Patrician Way
- 5880 Brooke Dr
- 5875 Water Canyon Rd
- 5865 Water Canyon Rd
- 5877 Water Canyon Rd
- 5505 Patrician Way
- 5565 Patrician Way
- 5855 Water Canyon Rd