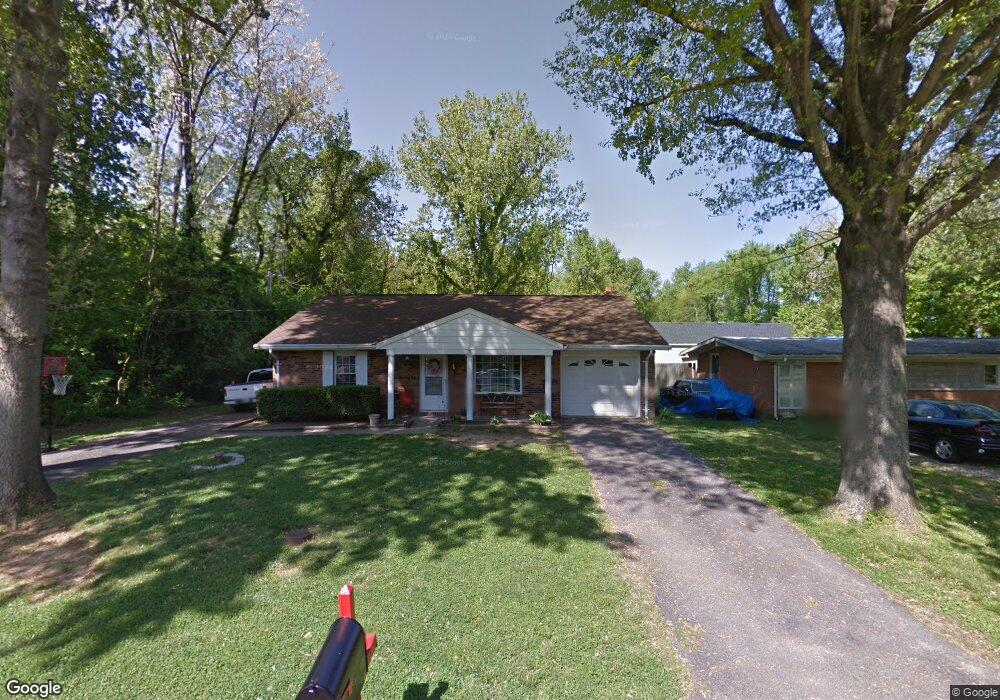
5855 Lenbeck Rd Newburgh, IN 47630
Estimated Value: $199,000 - $245,000
3
Beds
1
Bath
1,449
Sq Ft
$152/Sq Ft
Est. Value
About This Home
This home is located at 5855 Lenbeck Rd, Newburgh, IN 47630 and is currently estimated at $220,782, approximately $152 per square foot. 5855 Lenbeck Rd is a home located in Warrick County with nearby schools including Newburgh Elementary School, Castle North Middle School, and Castle High School.
Ownership History
Date
Name
Owned For
Owner Type
Purchase Details
Closed on
May 20, 2022
Sold by
Henson Deloris A and Britton Devin J
Bought by
Hoffman Tiffany N and Hoffman Lawrence
Current Estimated Value
Home Financials for this Owner
Home Financials are based on the most recent Mortgage that was taken out on this home.
Original Mortgage
$54,200
Outstanding Balance
$50,832
Interest Rate
4.72%
Mortgage Type
New Conventional
Estimated Equity
$169,950
Create a Home Valuation Report for This Property
The Home Valuation Report is an in-depth analysis detailing your home's value as well as a comparison with similar homes in the area
Home Values in the Area
Average Home Value in this Area
Purchase History
| Date | Buyer | Sale Price | Title Company |
|---|---|---|---|
| Hoffman Tiffany N | $63,750 | None Listed On Document | |
| Hoffman Tiffany N | $63,750 | First Advantage Title Services |
Source: Public Records
Mortgage History
| Date | Status | Borrower | Loan Amount |
|---|---|---|---|
| Open | Hoffman Tiffany N | $54,200 |
Source: Public Records
Tax History
| Year | Tax Paid | Tax Assessment Tax Assessment Total Assessment is a certain percentage of the fair market value that is determined by local assessors to be the total taxable value of land and additions on the property. | Land | Improvement |
|---|---|---|---|---|
| 2025 | $1,125 | $185,900 | $26,400 | $159,500 |
| 2024 | $1,125 | $169,000 | $26,400 | $142,600 |
| 2023 | $1,043 | $164,900 | $26,400 | $138,500 |
| 2022 | $834 | $137,600 | $23,400 | $114,200 |
| 2021 | $1,733 | $110,100 | $18,700 | $91,400 |
| 2020 | $1,707 | $101,900 | $17,200 | $84,700 |
| 2019 | $1,758 | $101,900 | $17,200 | $84,700 |
| 2018 | $1,675 | $101,900 | $17,200 | $84,700 |
| 2017 | $1,646 | $100,700 | $17,200 | $83,500 |
| 2016 | $1,653 | $101,700 | $17,200 | $84,500 |
| 2014 | $1,513 | $99,300 | $17,200 | $82,100 |
| 2013 | $1,504 | $101,000 | $17,200 | $83,800 |
Source: Public Records
Map
Nearby Homes
- 5833 Lenbeck Rd
- 2041 Polaris Ave
- 6066 Indian Dr
- 1920 Elna Kay Dr
- 5655 Garden Valley Rd
- 10411 Devon Ct
- 5788 Morningside Dr
- 10386 Regent Ct
- 6077 River Bluff Dr
- 10177 Kimberly Ln
- 7504 Pendleton Ave
- 8025 Washington Ave
- 1521 Martin Cir
- 5902 Lisa Ln
- 1831 Chickasaw Dr
- 10657 Fall Creek Dr
- 9998 Monte Way
- 7118 Pollack Ave
- 10166 Marquette St
- 7850 Brookshire Ct
Your Personal Tour Guide
Ask me questions while you tour the home.