Estimated payment $2,531/month
Highlights
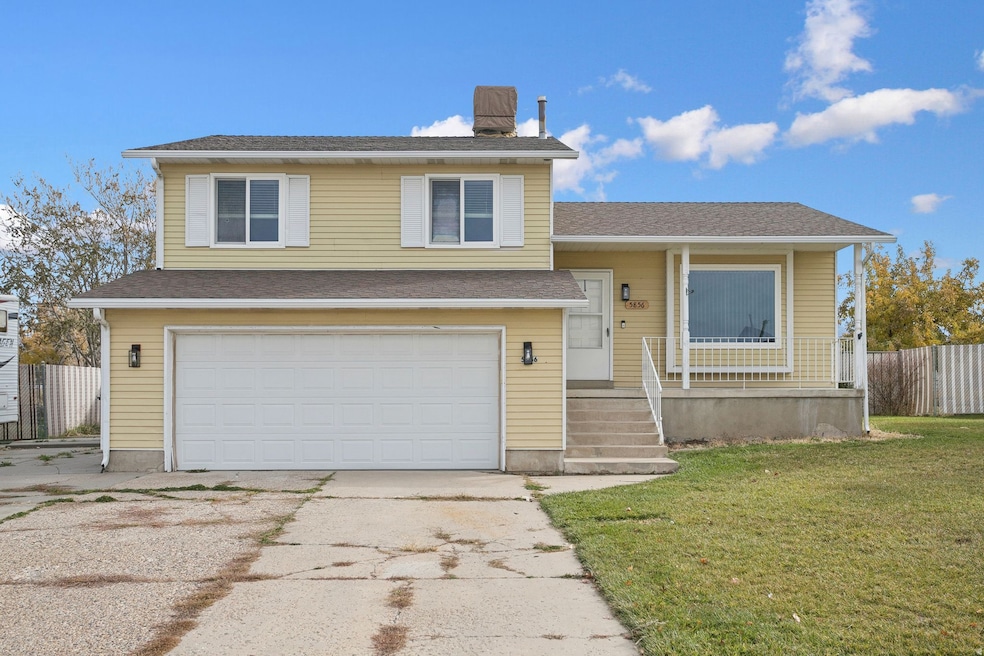
- Mature Trees
- No HOA
- 2 Car Attached Garage
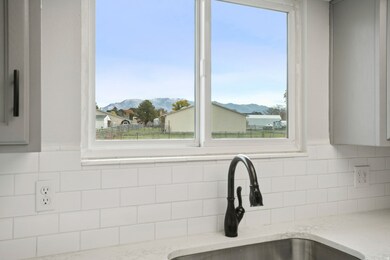
- Mountain View
- Porch
- Evaporated cooling system
About This Home
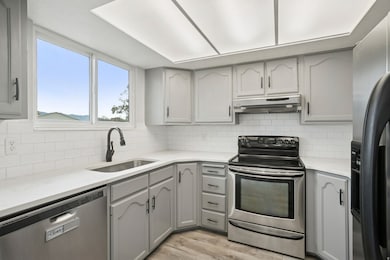
Move-in ready single-family home featuring beautiful mountain views and no direct backyard neighbor for added privacy. Conveniently located just a short drive from a large park with walking path, playground, and pickleball courts. Minutes away from freeway access and Hill Air Force Base. A perfect blend of comfort, convenience, and location!
Listing Agent
Thomas Vogel
Bureau Real Estate License #10072475 Listed on: 11/13/2025
Home Details
Home Type
- Single Family
Est. Annual Taxes
- $2,254
Year Built
- Built in 1984
Lot Details
- 6,970 Sq Ft Lot
- Property is Fully Fenced
- Landscaped
- Sprinkler System
- Mature Trees
- Property is zoned Single-Family
Parking
- 2 Car Attached Garage
Home Design
- Asphalt
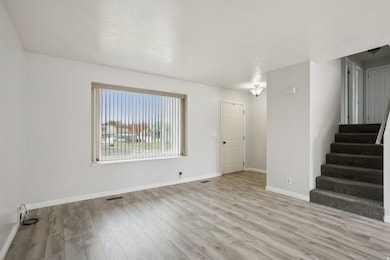
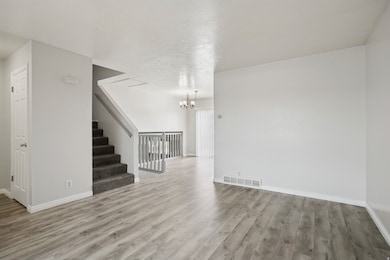
Interior Spaces
- 1,582 Sq Ft Home
- 3-Story Property
- Blinds
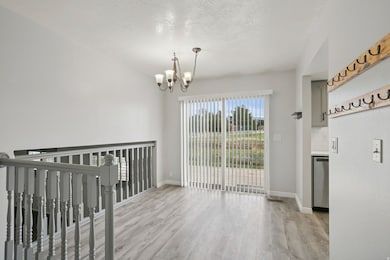
- Sliding Doors
- Mountain Views
- Partial Basement
- Storm Doors
Kitchen
- Free-Standing Range
- Microwave
- Disposal
Flooring
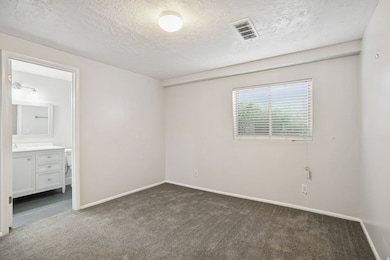
- Carpet
- Laminate
- Tile
Bedrooms and Bathrooms
- 4 Bedrooms
Laundry
- Dryer
- Washer
Outdoor Features
- Open Patio
- Porch
Schools
- Freedom Elementary School
- Roy Middle School
- Roy High School
Utilities
- Evaporated cooling system
- Forced Air Heating and Cooling System
- Natural Gas Connected
Community Details
- No Home Owners Association
Listing and Financial Details
- Assessor Parcel Number 09-255-0004
Map
Home Values in the Area
Average Home Value in this Area
Tax History
| Year | Tax Paid | Tax Assessment Tax Assessment Total Assessment is a certain percentage of the fair market value that is determined by local assessors to be the total taxable value of land and additions on the property. | Land | Improvement |
|---|---|---|---|---|
| 2025 | $2,254 | $399,280 | $135,000 | $264,280 |
| 2024 | $2,180 | $213,949 | $74,257 | $139,692 |
| 2023 | $2,103 | $206,800 | $65,968 | $140,832 |
| 2022 | $2,350 | $235,400 | $60,501 | $174,899 |
| 2021 | $1,769 | $294,000 | $80,017 | $213,983 |
| 2020 | $1,570 | $239,000 | $80,017 | $158,983 |
| 2019 | $1,628 | $234,000 | $45,048 | $188,952 |
| 2018 | $1,508 | $205,000 | $39,924 | $165,076 |
| 2017 | $1,413 | $181,000 | $39,924 | $141,076 |
| 2016 | $1,305 | $90,184 | $21,415 | $68,769 |
| 2015 | $1,122 | $79,971 | $21,415 | $58,556 |
| 2014 | $1,057 | $74,491 | $18,611 | $55,880 |
Property History
| Date | Event | Price | List to Sale | Price per Sq Ft |
|---|---|---|---|---|
| 11/13/2025 11/13/25 | For Sale | $444,490 | -- | $281 / Sq Ft |
Purchase History
| Date | Type | Sale Price | Title Company |
|---|---|---|---|
| Warranty Deed | -- | Oasis Title Llc | |
| Interfamily Deed Transfer | -- | Accommodation | |
| Warranty Deed | -- | Mountain America Title |
Mortgage History
| Date | Status | Loan Amount | Loan Type |
|---|---|---|---|
| Open | $332,298 | VA | |
| Previous Owner | $250,000 | VA |
Source: UtahRealEstate.com
MLS Number: 2122823
APN: 09-255-0004
Disclaimer: Certain information contained herein is derived from information provided by parties other than Homes.com. All information provided is deemed reliable, but is not guaranteed to be accurate and should be independently verified.
![]() IDX information is provided exclusively for consumers’ personal, non-commercial use, that it may not be used for any purpose other than to identify prospective properties consumers may be interested in purchasing, and that the data is deemed reliable but is not guaranteed accurate by the MLS. Licensor is only providing the MLS Content and not other sources of data provided in the Product.
IDX information is provided exclusively for consumers’ personal, non-commercial use, that it may not be used for any purpose other than to identify prospective properties consumers may be interested in purchasing, and that the data is deemed reliable but is not guaranteed accurate by the MLS. Licensor is only providing the MLS Content and not other sources of data provided in the Product.
Based on information from the Wasatch Front Regional Multiple Listing Service, Inc.. All data, including all measurements and calculations of area, is obtained from various sources and has not been, and will not be, verified by broker or the MLS. All information should be independently reviewed and verified for accuracy. Properties may or may not be listed by the office/agent presenting the information.