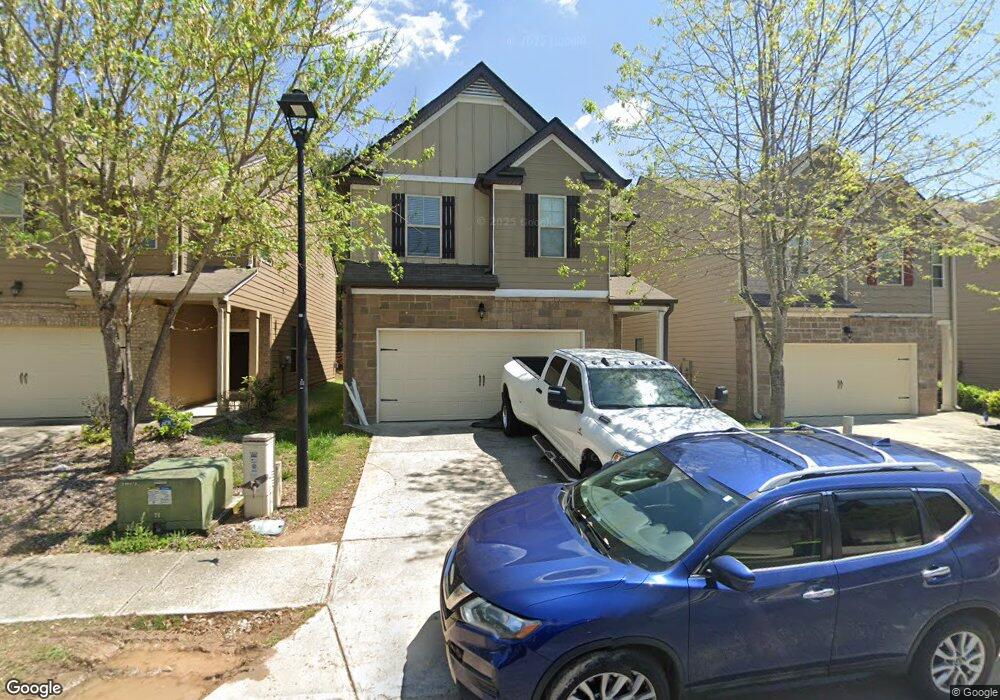
5856 Sepulveda Ln Unit 297 Atlanta, GA 30349
Estimated Value: $270,000 - $313,000
3
Beds
3
Baths
1,950
Sq Ft
$146/Sq Ft
Est. Value
About This Home
This home is located at 5856 Sepulveda Ln Unit 297, Atlanta, GA 30349 and is currently estimated at $285,230, approximately $146 per square foot. 5856 Sepulveda Ln Unit 297 is a home located in Clayton County with nearby schools including Northcutt Elementary School, North Clayton Middle School, and North Clayton High School.
Ownership History
Date
Name
Owned For
Owner Type
Purchase Details
Closed on
Dec 3, 2021
Sold by
Zillow Homes Property Trust
Bought by
Mch Sfr Property Owner 1 Llc
Current Estimated Value
Purchase Details
Closed on
Aug 13, 2021
Sold by
Jones Raymone A
Bought by
Zillow Homes Property Trust
Purchase Details
Closed on
Nov 17, 2016
Sold by
Dr Horton & Wph Llc
Bought by
Jones Raymone A
Home Financials for this Owner
Home Financials are based on the most recent Mortgage that was taken out on this home.
Original Mortgage
$164,834
Interest Rate
3.52%
Mortgage Type
VA
Purchase Details
Closed on
Aug 31, 2016
Sold by
Wilson Parker Homes Of Cre
Bought by
Dr Horton Whp Llc
Purchase Details
Closed on
Jun 3, 2016
Sold by
Atlas Of Crenshaw Park Llc
Bought by
Wilson Parker Homes Of Crenshaw Park Inc
Create a Home Valuation Report for This Property
The Home Valuation Report is an in-depth analysis detailing your home's value as well as a comparison with similar homes in the area
Home Values in the Area
Average Home Value in this Area
Purchase History
| Date | Buyer | Sale Price | Title Company |
|---|---|---|---|
| Mch Sfr Property Owner 1 Llc | $277,900 | -- | |
| Zillow Homes Property Trust | $257,502 | -- | |
| Jones Raymone A | $161,365 | -- | |
| Dr Horton Whp Llc | $778,068 | -- | |
| Wilson Parker Homes Of Crenshaw Park Inc | $90,000 | -- |
Source: Public Records
Mortgage History
| Date | Status | Borrower | Loan Amount |
|---|---|---|---|
| Previous Owner | Jones Raymone A | $164,834 |
Source: Public Records
Tax History Compared to Growth
Tax History
| Year | Tax Paid | Tax Assessment Tax Assessment Total Assessment is a certain percentage of the fair market value that is determined by local assessors to be the total taxable value of land and additions on the property. | Land | Improvement |
|---|---|---|---|---|
| 2024 | $4,641 | $118,000 | $9,600 | $108,400 |
| 2023 | $4,299 | $118,000 | $9,600 | $108,400 |
| 2022 | $3,691 | $93,080 | $9,600 | $83,480 |
| 2021 | $2,719 | $77,880 | $9,600 | $68,280 |
| 2020 | $2,365 | $68,173 | $9,600 | $58,573 |
| 2019 | $2,800 | $68,026 | $5,600 | $62,426 |
| 2018 | $3,012 | $73,262 | $5,600 | $67,662 |
| 2017 | $2,612 | $63,250 | $5,600 | $57,650 |
| 2016 | $266 | $5,600 | $5,600 | $0 |
| 2015 | $77 | $0 | $0 | $0 |
| 2014 | $77 | $980 | $980 | $0 |
Source: Public Records
Map
Nearby Homes
- 5854 El Segundo Way
- 1947 Eshelman Ct
- 5768 Grande River Rd
- 5950 Milligan Ct
- 5937 Yellowood Ct
- 1618 Blossom Dr
- 1969 Banks Way
- 6073 Camden Forrest Dr
- 1125 Knight Ct
- 1853 Broad River Rd
- 6076 Camden Forrest Dr
- 6105 Camden Forrest Ct
- 6080 Camden Forrest Cove
- 5728 Norman Ct
- 5668 Williamsburg Trace
- 6105 E Fayetteville Dr
- 5856 Sepulveda Ln
- 5854 Sepulveda Ln Unit 298
- 5854 Sepulveda Ln
- 5858 Sepulveda Ln Unit 296
- 5858 Sepulveda Ln
- 5852 Sepulveda Ln
- 5860 Sepulveda Ln Unit 295
- 5860 Sepulveda Ln
- 0 Sepulveda Ln Unit 8399637
- 0 Sepulveda Ln Unit 8149585
- 0 Sepulveda Ln Unit 3219664
- 0 Sepulveda Ln Unit 7355433
- 0 Sepulveda Ln Unit 8734525
- 0 Sepulveda Ln Unit 3030553
- 0 Sepulveda Ln Unit 3159986
- 5850 Sepulveda Ln
- 5862 Sepulveda Ln Unit 294
- 5862 Sepulveda Ln
- 5864 Sepulveda Ln Unit 293
- 5864 Sepulveda Ln