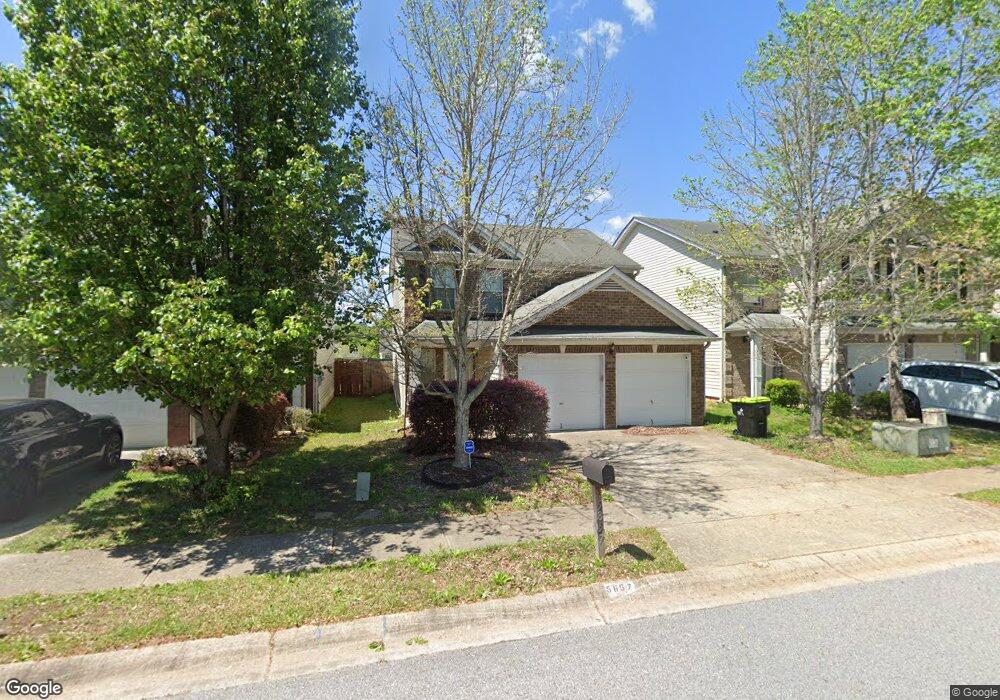
5857 El Segundo Way Unit 93 Atlanta, GA 30349
Estimated Value: $242,000 - $274,000
3
Beds
3
Baths
1,684
Sq Ft
$152/Sq Ft
Est. Value
About This Home
This home is located at 5857 El Segundo Way Unit 93, Atlanta, GA 30349 and is currently estimated at $255,346, approximately $151 per square foot. 5857 El Segundo Way Unit 93 is a home located in Clayton County with nearby schools including Northcutt Elementary School, North Clayton Middle School, and North Clayton High School.
Ownership History
Date
Name
Owned For
Owner Type
Purchase Details
Closed on
Aug 13, 2020
Sold by
Herring Tenisha
Bought by
Watson Akim
Current Estimated Value
Home Financials for this Owner
Home Financials are based on the most recent Mortgage that was taken out on this home.
Original Mortgage
$166,500
Outstanding Balance
$147,697
Interest Rate
3%
Mortgage Type
New Conventional
Estimated Equity
$107,649
Purchase Details
Closed on
May 30, 2008
Sold by
Legacy Cmntys Of Crenshaw Park
Bought by
Herring Tenisha
Home Financials for this Owner
Home Financials are based on the most recent Mortgage that was taken out on this home.
Original Mortgage
$141,085
Interest Rate
6.02%
Mortgage Type
FHA
Purchase Details
Closed on
Mar 19, 2008
Sold by
Legacy Investment Group Llc
Bought by
Legacy Cmntys Of Crenshaw Park
Home Financials for this Owner
Home Financials are based on the most recent Mortgage that was taken out on this home.
Original Mortgage
$270,000
Interest Rate
5.68%
Create a Home Valuation Report for This Property
The Home Valuation Report is an in-depth analysis detailing your home's value as well as a comparison with similar homes in the area
Home Values in the Area
Average Home Value in this Area
Purchase History
| Date | Buyer | Sale Price | Title Company |
|---|---|---|---|
| Watson Akim | $166,500 | -- | |
| Herring Tenisha | $142,200 | -- | |
| Legacy Cmntys Of Crenshaw Park | $68,000 | -- |
Source: Public Records
Mortgage History
| Date | Status | Borrower | Loan Amount |
|---|---|---|---|
| Open | Watson Akim | $166,500 | |
| Previous Owner | Herring Tenisha | $141,085 | |
| Previous Owner | Legacy Cmntys Of Crenshaw Park | $270,000 |
Source: Public Records
Tax History Compared to Growth
Tax History
| Year | Tax Paid | Tax Assessment Tax Assessment Total Assessment is a certain percentage of the fair market value that is determined by local assessors to be the total taxable value of land and additions on the property. | Land | Improvement |
|---|---|---|---|---|
| 2024 | $3,490 | $98,480 | $9,600 | $88,880 |
| 2023 | $3,694 | $102,320 | $9,600 | $92,720 |
| 2022 | $2,923 | $83,520 | $9,600 | $73,920 |
| 2021 | $2,758 | $68,880 | $9,600 | $59,280 |
| 2020 | $1,994 | $58,905 | $9,600 | $49,305 |
| 2019 | $1,833 | $54,218 | $4,400 | $49,818 |
| 2018 | $1,492 | $45,826 | $4,400 | $41,426 |
| 2017 | $1,402 | $43,513 | $4,400 | $39,113 |
| 2016 | $944 | $32,268 | $4,400 | $27,868 |
| 2015 | $822 | $0 | $0 | $0 |
| 2014 | $723 | $27,204 | $4,400 | $22,804 |
Source: Public Records
Map
Nearby Homes
- 5854 El Segundo Way
- 1947 Eshelman Ct
- 5950 Milligan Ct
- 1969 Banks Way
- 1125 Knight Ct
- 5768 Grande River Rd
- 1853 Broad River Rd
- 6105 Camden Forrest Ct
- 5937 Yellowood Ct
- 6073 Camden Forrest Dr
- 1618 Blossom Dr
- 6076 Camden Forrest Dr
- 6080 Camden Forrest Cove
- 5728 Norman Ct
- 1991 Flat Shoals Rd
- 2039 Faith Cove
- 1615 Potomac Ct
- 6105 E Fayetteville Dr
- 5857 El Segundo Way
- 5855 El Segundo Way
- 5859 El Segundo Way
- 5853 El Segundo Way
- 5861 El Segundo Way
- 1878 Roble Dr
- 1876 Roble Dr
- 1880 Roble Dr
- 5851 El Segundo Way
- 5863 El Segundo Way
- 1874 Roble Dr
- 1882 Roble Dr
- 5858 El Segundo Way
- 1872 Roble Dr
- 5849 El Segundo Way
- 5856 El Segundo Way
- 1884 Roble Dr
- 5852 El Segundo Way Unit 143
- 5852 El Segundo Way
- 5860 El Segundo Way