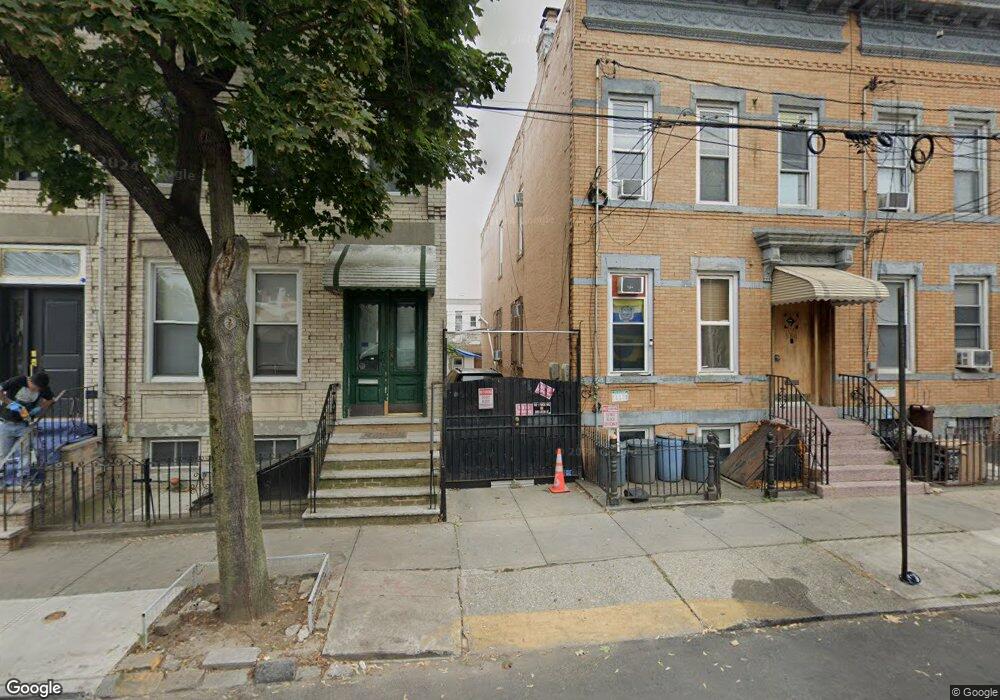
586 Fairview Ave Unit 2F Ridgewood, NY 11385
Ridgewood NeighborhoodEstimated Value: $511,590 - $1,392,000
1
Bed
1
Bath
550
Sq Ft
$1,961/Sq Ft
Est. Value
About This Home
This home is located at 586 Fairview Ave Unit 2F, Ridgewood, NY 11385 and is currently estimated at $1,078,648, approximately $1,961 per square foot. 586 Fairview Ave Unit 2F is a home located in Queens County with nearby schools including P.S. 71 Forest, I.S. 093 Ridgewood, and Grover Cleveland High School.
Ownership History
Date
Name
Owned For
Owner Type
Purchase Details
Closed on
Sep 23, 2008
Sold by
Credit Suisse First Boston 2005-10 and Us Bank National Association As Trustee
Bought by
Lian Gold Group Inc
Current Estimated Value
Home Financials for this Owner
Home Financials are based on the most recent Mortgage that was taken out on this home.
Original Mortgage
$270,000
Outstanding Balance
$179,759
Interest Rate
6.54%
Mortgage Type
Purchase Money Mortgage
Estimated Equity
$898,889
Purchase Details
Closed on
Jul 29, 2005
Sold by
Orellana Jorge and Orellana Nelly
Bought by
Maurad Genaro and Zhicay Gonzalo
Home Financials for this Owner
Home Financials are based on the most recent Mortgage that was taken out on this home.
Original Mortgage
$116,450
Interest Rate
5.54%
Create a Home Valuation Report for This Property
The Home Valuation Report is an in-depth analysis detailing your home's value as well as a comparison with similar homes in the area
Home Values in the Area
Average Home Value in this Area
Purchase History
| Date | Buyer | Sale Price | Title Company |
|---|---|---|---|
| Lian Gold Group Inc | $300,000 | -- | |
| Lian Gold Group Inc | $300,000 | -- | |
| Maurad Genaro | $685,000 | -- | |
| Maurad Genaro | $685,000 | -- |
Source: Public Records
Mortgage History
| Date | Status | Borrower | Loan Amount |
|---|---|---|---|
| Open | Lian Gold Group Inc | $270,000 | |
| Closed | Lian Gold Group Inc | $270,000 | |
| Previous Owner | Maurad Genaro | $116,450 | |
| Previous Owner | Maurad Genaro | $548,000 |
Source: Public Records
Tax History Compared to Growth
Tax History
| Year | Tax Paid | Tax Assessment Tax Assessment Total Assessment is a certain percentage of the fair market value that is determined by local assessors to be the total taxable value of land and additions on the property. | Land | Improvement |
|---|---|---|---|---|
| 2025 | $7,685 | $40,523 | $9,348 | $31,175 |
| 2024 | $7,685 | $38,263 | $10,579 | $27,684 |
| 2023 | $7,254 | $36,116 | $8,540 | $27,576 |
| 2022 | $6,866 | $60,540 | $13,620 | $46,920 |
| 2021 | $7,239 | $60,900 | $13,620 | $47,280 |
| 2020 | $7,148 | $58,920 | $13,620 | $45,300 |
| 2019 | $6,670 | $58,920 | $13,620 | $45,300 |
| 2018 | $6,135 | $30,097 | $5,951 | $24,146 |
| 2017 | $5,843 | $28,663 | $7,773 | $20,890 |
| 2016 | $5,730 | $28,663 | $7,773 | $20,890 |
| 2015 | $3,261 | $28,141 | $7,986 | $20,155 |
| 2014 | $3,261 | $26,572 | $9,049 | $17,523 |
Source: Public Records
Map
Nearby Homes
- 20-22 Menahan St
- 20-35 Menahan St
- 2027 Bleecker St
- 59-46 Linden St
- 1904 Harman St Unit 1 B
- 1904 Harman St Unit 3 B
- 1904 Harman St Unit 3 A
- 2135 Menahan St
- 586 Onderdonk Ave
- 1916 Himrod St
- 19-16 Himrod St
- 508 Onderdonk Ave
- 1823 Bleecker St
- 63-16 Forest Ave Unit 1B
- 66-42 Forest Ave
- 5929 Linden St
- 6315 Forest Ave Unit 1A
- 756 Woodward Ave
- 5932 Grove St
- 1851 Madison St
- 586 Fairview Ave
- 584 Fairview Ave
- 582 Fairview Ave
- 582 Fairview Ave Unit 1R
- 588 Fairview Ave
- 590 Fairview Ave
- 580 Fairview Ave
- 580 Fairview Ave
- 580 Fairview Ave Unit 1R
- 580 Fairview Ave Unit 2L
- 580 Fairview Ave Unit 1L
- 592 Fairview Ave
- 578 Fairview Ave
- 578 Fairview Ave Unit 1R
- 578 Fairview Ave Unit 2L
- 578 Fairview Ave Unit 2R
- 578 Fairview Ave Unit 1L
- 11 St Johns Rd
- 576 Fairview Ave
- 11 Saint Johns Rd