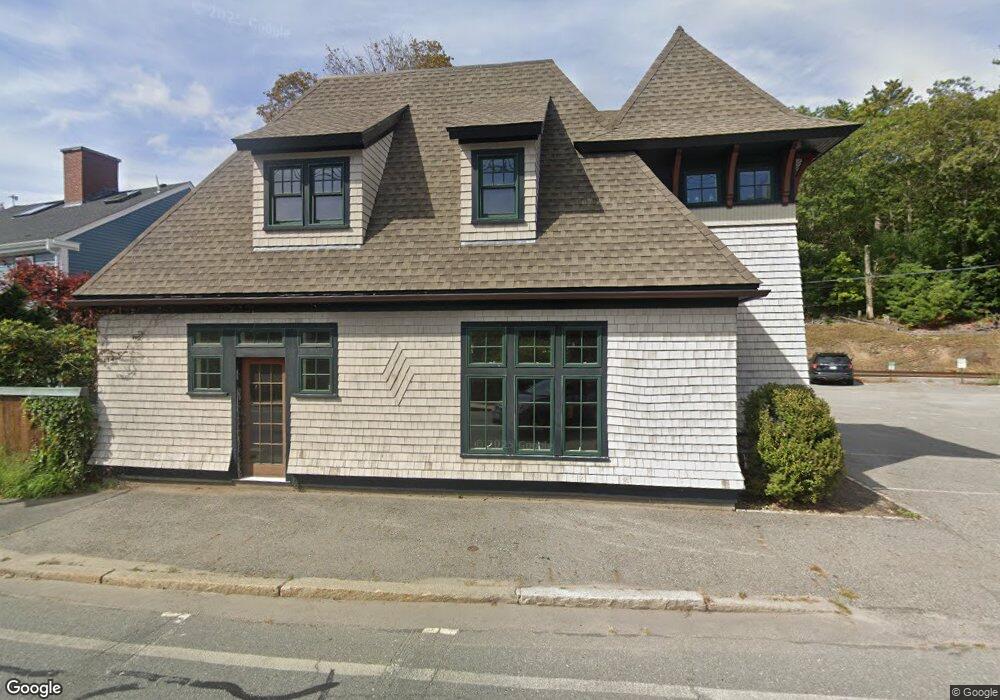
586 Hale St Unit 3 Beverly, MA 01915
Studio
--
Bath
2,927
Sq Ft
0.3
Acres
About This Home
This home is located at 586 Hale St Unit 3, Beverly, MA 01915. 586 Hale St Unit 3 is a home located in Essex County with nearby schools including Beverly High School, Glen Urquhart School, and Harborlight Montessori School.
Ownership History
Date
Name
Owned For
Owner Type
Purchase Details
Closed on
Feb 18, 2020
Sold by
64 Thissell Street Llc
Bought by
586 Hale Street Llc
Purchase Details
Closed on
Jan 29, 2019
Sold by
586 Hale Street Llc
Bought by
64 Thissell Street Llc
Purchase Details
Closed on
Mar 23, 2011
Sold by
Misu Realty Co Llc
Bought by
586 Hale Street Llc
Purchase Details
Closed on
Sep 3, 1998
Sold by
Stores At Prides Cross and Kellogg
Bought by
Misu Realty Co Llc
Home Financials for this Owner
Home Financials are based on the most recent Mortgage that was taken out on this home.
Original Mortgage
$230,000
Interest Rate
6.9%
Mortgage Type
Purchase Money Mortgage
Create a Home Valuation Report for This Property
The Home Valuation Report is an in-depth analysis detailing your home's value as well as a comparison with similar homes in the area
Purchase History
| Date | Buyer | Sale Price | Title Company |
|---|---|---|---|
| 586 Hale Street Llc | -- | None Available | |
| 64 Thissell Street Llc | $1,300,000 | -- | |
| 586 Hale Street Llc | $430,000 | -- | |
| Misu Realty Co Llc | $325,000 | -- |
Source: Public Records
Mortgage History
| Date | Status | Borrower | Loan Amount |
|---|---|---|---|
| Previous Owner | Misu Realty Co Llc | $230,000 |
Source: Public Records
Tax History
| Year | Tax Paid | Tax Assessment Tax Assessment Total Assessment is a certain percentage of the fair market value that is determined by local assessors to be the total taxable value of land and additions on the property. | Land | Improvement |
|---|---|---|---|---|
| 2025 | $20,662 | $927,400 | $423,600 | $503,800 |
| 2024 | $20,662 | $878,500 | $403,400 | $475,100 |
| 2023 | $0 | $875,100 | $403,400 | $471,700 |
| 2022 | $0 | $846,000 | $383,300 | $462,700 |
| 2021 | $21,424 | $836,200 | $363,100 | $473,100 |
| 2020 | $22,087 | $835,500 | $362,400 | $473,100 |
| 2019 | $21,230 | $835,500 | $362,400 | $473,100 |
| 2018 | $20,970 | $815,300 | $342,200 | $473,100 |
| 2017 | $20,007 | $745,700 | $302,000 | $443,700 |
| 2016 | $19,694 | $745,700 | $302,000 | $443,700 |
| 2015 | $19,164 | $745,700 | $302,000 | $443,700 |
Source: Public Records
Map
Nearby Homes
Your Personal Tour Guide
Ask me questions while you tour the home.