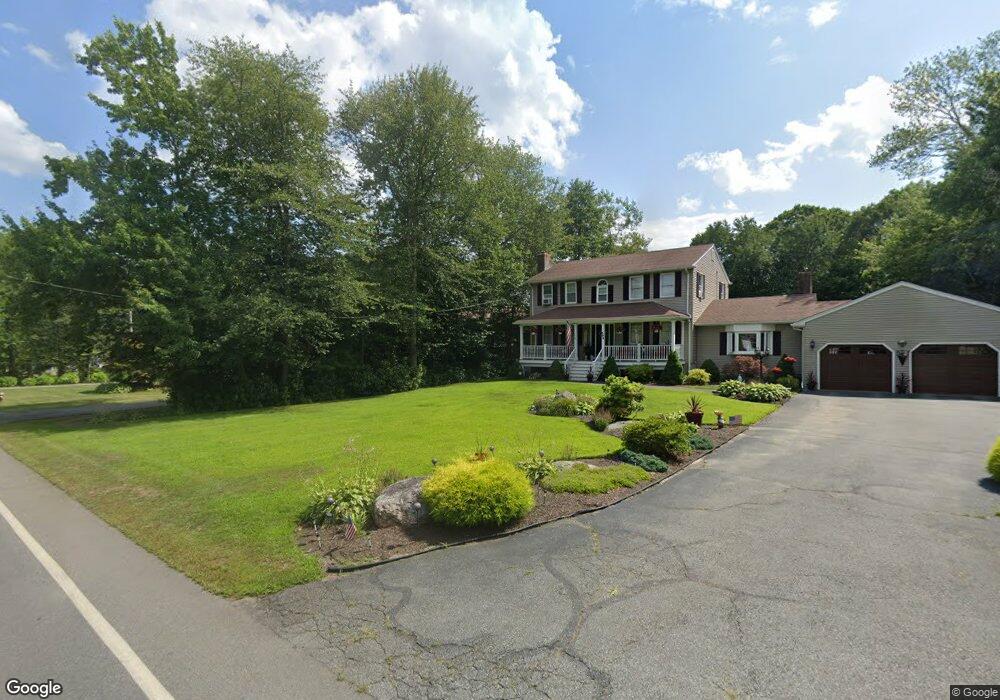
586 Locust St Swansea, MA 02777
West Swansea NeighborhoodEstimated Value: $677,176 - $1,132,000
3
Beds
3
Baths
1,996
Sq Ft
$411/Sq Ft
Est. Value
About This Home
This home is located at 586 Locust St, Swansea, MA 02777 and is currently estimated at $820,294, approximately $410 per square foot. 586 Locust St is a home located in Bristol County with nearby schools including Joseph Case High School and Swansea Wood School.
Ownership History
Date
Name
Owned For
Owner Type
Purchase Details
Closed on
Jun 9, 2023
Sold by
Desilva Manuel and De Silva Maria
Bought by
De Silva Irt and De Silva
Current Estimated Value
Purchase Details
Closed on
Mar 31, 2023
Sold by
Silva Manuel D and Silva Maria N
Bought by
Silva Jeffrey D
Purchase Details
Closed on
Sep 29, 1992
Sold by
Couaato John S and Couto Maria
Bought by
Desilva Manuel and Desilva Maria N
Home Financials for this Owner
Home Financials are based on the most recent Mortgage that was taken out on this home.
Original Mortgage
$197,000
Interest Rate
7.9%
Mortgage Type
Purchase Money Mortgage
Create a Home Valuation Report for This Property
The Home Valuation Report is an in-depth analysis detailing your home's value as well as a comparison with similar homes in the area
Home Values in the Area
Average Home Value in this Area
Purchase History
| Date | Buyer | Sale Price | Title Company |
|---|---|---|---|
| De Silva Irt | -- | None Available | |
| De Silva Irt | -- | None Available | |
| Silva Jeffrey D | -- | None Available | |
| Silva Jeffrey D | -- | None Available | |
| Desilva Manuel | $247,000 | -- | |
| Desilva Manuel | $247,000 | -- |
Source: Public Records
Mortgage History
| Date | Status | Borrower | Loan Amount |
|---|---|---|---|
| Previous Owner | Desilva Manuel | $118,500 | |
| Previous Owner | Desilva Manuel | $197,000 |
Source: Public Records
Tax History Compared to Growth
Tax History
| Year | Tax Paid | Tax Assessment Tax Assessment Total Assessment is a certain percentage of the fair market value that is determined by local assessors to be the total taxable value of land and additions on the property. | Land | Improvement |
|---|---|---|---|---|
| 2025 | $7,319 | $614,000 | $185,000 | $429,000 |
| 2024 | $7,901 | $659,000 | $196,000 | $463,000 |
| 2023 | $6,260 | $476,800 | $148,900 | $327,900 |
| 2022 | $6,273 | $435,900 | $137,200 | $298,700 |
| 2021 | $6,813 | $435,900 | $137,200 | $298,700 |
| 2020 | $6,754 | $433,500 | $137,200 | $296,300 |
| 2019 | $6,682 | $430,800 | $124,600 | $306,200 |
| 2018 | $7,113 | $465,500 | $122,900 | $342,600 |
| 2017 | $6,093 | $458,800 | $122,900 | $335,900 |
| 2016 | $5,684 | $420,400 | $108,600 | $311,800 |
| 2015 | $5,423 | $413,000 | $108,600 | $304,400 |
| 2014 | $5,110 | $398,000 | $108,600 | $289,400 |
Source: Public Records
Map
Nearby Homes