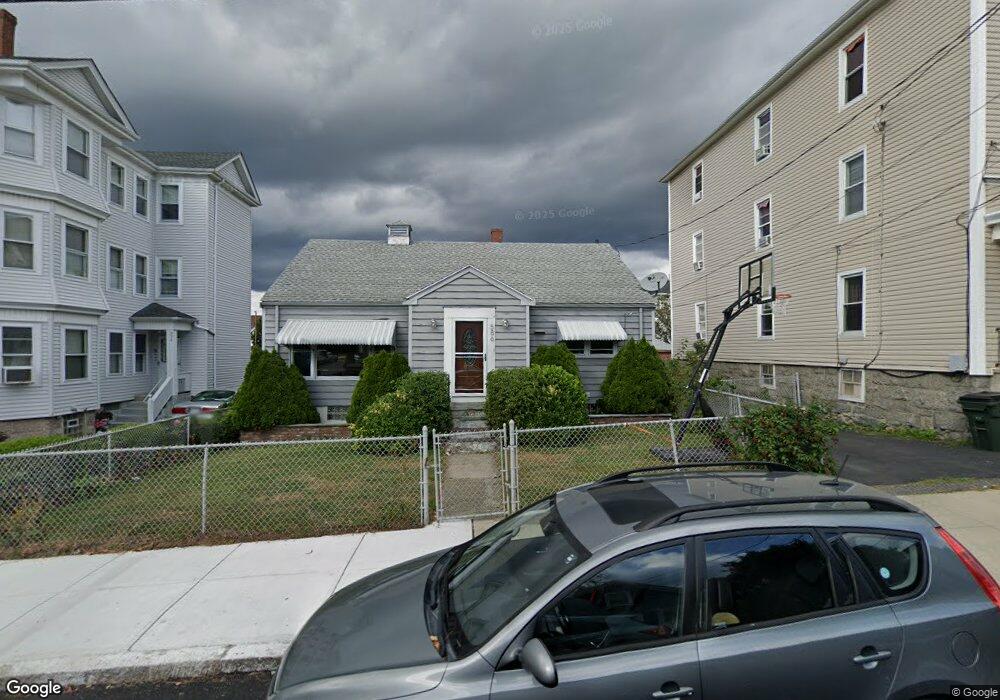
586 Slade St Fall River, MA 02724
Father Kelly NeighborhoodEstimated Value: $396,000 - $415,996
3
Beds
2
Baths
2,220
Sq Ft
$185/Sq Ft
Est. Value
About This Home
This home is located at 586 Slade St, Fall River, MA 02724 and is currently estimated at $409,749, approximately $184 per square foot. 586 Slade St is a home located in Bristol County with nearby schools including Carlton M. Viveiros Elementary School, Matthew J. Kuss Middle School, and B M C Durfee High School.
Ownership History
Date
Name
Owned For
Owner Type
Purchase Details
Closed on
Nov 4, 2021
Sold by
Mello Scott G and Botelho Bethanne
Bought by
Mello Scott G
Current Estimated Value
Purchase Details
Closed on
Jun 14, 2007
Sold by
Mello Edward
Bought by
Botelho Bethanne and Mello Scott G
Home Financials for this Owner
Home Financials are based on the most recent Mortgage that was taken out on this home.
Original Mortgage
$164,400
Interest Rate
6.19%
Mortgage Type
Purchase Money Mortgage
Purchase Details
Closed on
Apr 19, 2006
Sold by
Mello Alberta H and Mello Edward
Bought by
Mello Edward
Create a Home Valuation Report for This Property
The Home Valuation Report is an in-depth analysis detailing your home's value as well as a comparison with similar homes in the area
Home Values in the Area
Average Home Value in this Area
Purchase History
| Date | Buyer | Sale Price | Title Company |
|---|---|---|---|
| Mello Scott G | -- | None Available | |
| Botelho Bethanne | $205,500 | -- | |
| Mello Edward | -- | -- |
Source: Public Records
Mortgage History
| Date | Status | Borrower | Loan Amount |
|---|---|---|---|
| Previous Owner | Botelho Bethanne | $164,400 |
Source: Public Records
Tax History
| Year | Tax Paid | Tax Assessment Tax Assessment Total Assessment is a certain percentage of the fair market value that is determined by local assessors to be the total taxable value of land and additions on the property. | Land | Improvement |
|---|---|---|---|---|
| 2025 | $4,025 | $351,500 | $126,400 | $225,100 |
| 2024 | $3,799 | $330,600 | $121,600 | $209,000 |
| 2023 | $3,323 | $270,800 | $104,300 | $166,500 |
| 2022 | $2,752 | $228,800 | $94,800 | $134,000 |
| 2021 | $2,752 | $199,000 | $87,700 | $111,300 |
| 2020 | $2,647 | $183,200 | $83,900 | $99,300 |
| 2019 | $2,509 | $172,100 | $79,900 | $92,200 |
| 2018 | $2,450 | $167,600 | $78,500 | $89,100 |
| 2017 | $2,346 | $167,600 | $80,100 | $87,500 |
| 2016 | $2,265 | $166,200 | $83,400 | $82,800 |
| 2015 | $2,133 | $163,100 | $80,300 | $82,800 |
| 2014 | $2,105 | $167,300 | $84,500 | $82,800 |
Source: Public Records
Map
Nearby Homes
- 24 Hall St
- 76 Church St
- 20 Wilcox St
- 636-644 Dwelly St
- 1334 S Main St
- 644-648 King Philip St
- 234 Kilburn St
- 464 Birch St
- 917 Dwelly St
- 1846 S Main St
- 609 King Philip St
- 1273-1279 S Main St
- 1852 S Main St
- 344-354 E Main St
- 57 Larouche St
- 15 Higgins St
- 245 Dwelly St
- 240 Montaup St
- 310 King Philip St
- 71 Mystic St Unit 3
Your Personal Tour Guide
Ask me questions while you tour the home.