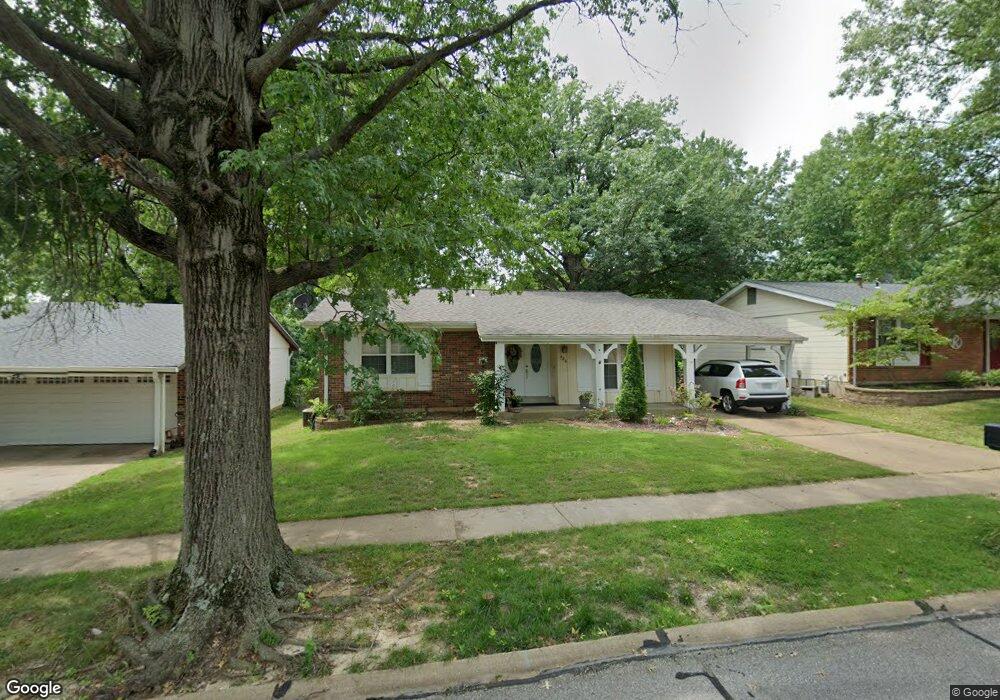
586 Twigwood Dr Ballwin, MO 63021
Estimated Value: $262,000 - $336,000
3
Beds
3
Baths
1,284
Sq Ft
$238/Sq Ft
Est. Value
About This Home
This home is located at 586 Twigwood Dr, Ballwin, MO 63021 and is currently estimated at $304,971, approximately $237 per square foot. 586 Twigwood Dr is a home located in St. Louis County with nearby schools including Woerther Elementary School, Selvidge Middle School, and Marquette Sr. High School.
Ownership History
Date
Name
Owned For
Owner Type
Purchase Details
Closed on
May 25, 2012
Sold by
Secretary Of Housing & Urban Development
Bought by
Jones Deborah A
Current Estimated Value
Home Financials for this Owner
Home Financials are based on the most recent Mortgage that was taken out on this home.
Original Mortgage
$102,885
Outstanding Balance
$71,384
Interest Rate
3.93%
Mortgage Type
New Conventional
Estimated Equity
$233,587
Purchase Details
Closed on
Oct 6, 2011
Sold by
Citimortgage Inc
Bought by
Secretary Of Housing & Urban Development
Purchase Details
Closed on
Sep 30, 2011
Sold by
Thorn Amy E
Bought by
Citimortgage Inc
Purchase Details
Closed on
Jul 1, 2002
Sold by
Thorn Keith Wayne
Bought by
Thorn Amy E
Purchase Details
Closed on
Oct 29, 1999
Sold by
Scheffing Donald G and Scheffing Mary H
Bought by
Thorn Keith W and Thorn Amy E
Home Financials for this Owner
Home Financials are based on the most recent Mortgage that was taken out on this home.
Original Mortgage
$116,750
Interest Rate
7.5%
Create a Home Valuation Report for This Property
The Home Valuation Report is an in-depth analysis detailing your home's value as well as a comparison with similar homes in the area
Home Values in the Area
Average Home Value in this Area
Purchase History
| Date | Buyer | Sale Price | Title Company |
|---|---|---|---|
| Jones Deborah A | $108,300 | None Available | |
| Secretary Of Housing & Urban Development | $224,935 | None Available | |
| Citimortgage Inc | $224,935 | None Available | |
| Thorn Amy E | -- | -- | |
| Thorn Keith W | $122,900 | -- |
Source: Public Records
Mortgage History
| Date | Status | Borrower | Loan Amount |
|---|---|---|---|
| Open | Jones Deborah A | $102,885 | |
| Previous Owner | Thorn Keith W | $116,750 |
Source: Public Records
Tax History
| Year | Tax Paid | Tax Assessment Tax Assessment Total Assessment is a certain percentage of the fair market value that is determined by local assessors to be the total taxable value of land and additions on the property. | Land | Improvement |
|---|---|---|---|---|
| 2025 | $3,488 | $53,750 | $27,800 | $25,950 |
| 2024 | $3,488 | $49,760 | $21,620 | $28,140 |
| 2023 | $3,485 | $49,760 | $21,620 | $28,140 |
| 2022 | $3,118 | $41,310 | $18,530 | $22,780 |
| 2021 | $3,095 | $41,310 | $18,530 | $22,780 |
| 2020 | $2,913 | $37,050 | $15,430 | $21,620 |
| 2019 | $2,925 | $37,050 | $15,430 | $21,620 |
| 2018 | $2,856 | $34,100 | $11,570 | $22,530 |
| 2017 | $2,788 | $34,100 | $11,570 | $22,530 |
| 2016 | $2,322 | $27,260 | $9,270 | $17,990 |
Source: Public Records
Map
Nearby Homes
- 533 Golfwood Dr
- 318 Statewood Dr
- 713 Village Wood Ct
- 365 Remington Way Dr
- 618 Running Creek Dr
- 717 Woodrun Dr
- 279 Aspen Village Dr
- 760 Woodside Trails Dr Unit 203
- 857 Village Meadow Dr
- 634 Parker Dr
- 604 Pine Ridge Trails Ct Unit 202
- 614 Barton Ln
- 284 Brightfield Dr
- 134 Cascade Terrace Dr
- 275 Essen Ct Unit TBB
- 973 Oakwood Farms Ln
- 589 Wetherby Terrace Dr
- 101 Half Moon Bay Ln
- 1110 Kiefer Creek Rd
- 112 Shirley Ln
- 580 Twigwood Dr
- 590 Twigwood Dr
- 576 Twigwood Dr
- 594 Twigwood Dr
- 583 Twigwood Dr
- 598 Twigwood Dr
- 591 Twigwood Dr
- 579 Twigwood Dr
- 595 Twigwood Dr
- 564 Twigwood Dr
- 575 Twigwood Dr
- 606 Twigwood Dr
- 572 Lemonwood Dr
- 603 Twigwood Dr
- 560 Twigwood Dr
- 566 Lemonwood Dr
- 416 Harvest Hill Ct
- 412 Harvest Hill Ct
- 408 Harvest Hill Ct
- 578 Lemonwood Dr
Your Personal Tour Guide
Ask me questions while you tour the home.