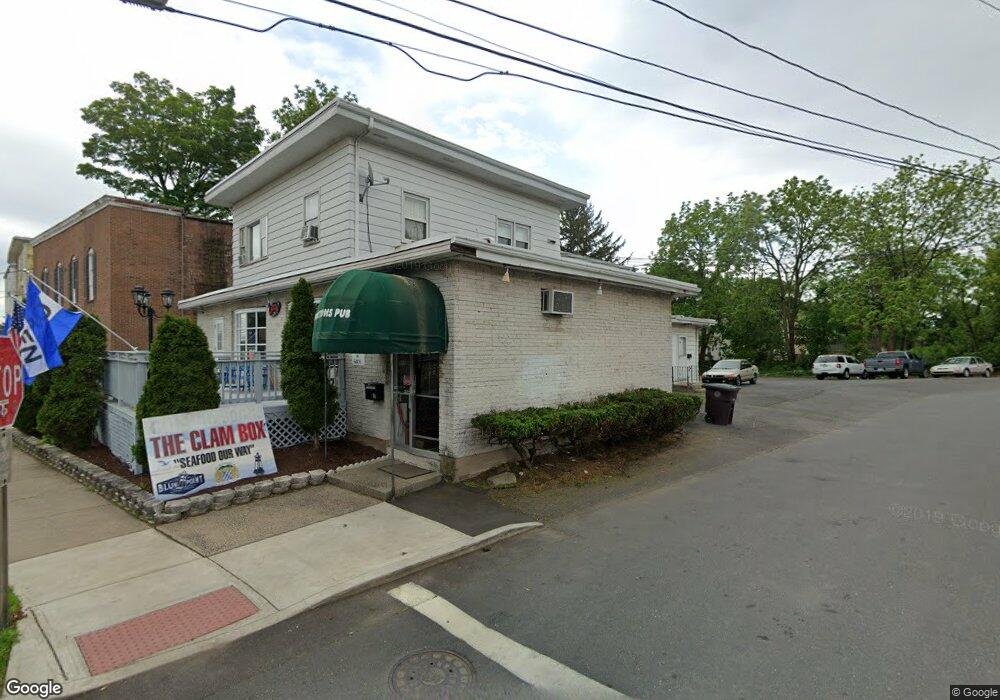
586 W Main St New Britain, CT 06053
Estimated Value: $418,609
5
Beds
7
Baths
3,129
Sq Ft
$134/Sq Ft
Est. Value
About This Home
This home is located at 586 W Main St, New Britain, CT 06053 and is currently estimated at $418,609, approximately $133 per square foot. 586 W Main St is a home located in Hartford County with nearby schools including Lincoln School, Slade Middle School, and Mountain Laurel Sudbury School.
Ownership History
Date
Name
Owned For
Owner Type
Purchase Details
Closed on
Jun 28, 2004
Sold by
Kudla Lori
Bought by
Real Prop Solutions Ll
Current Estimated Value
Purchase Details
Closed on
May 31, 2001
Sold by
Lombardo Felix N
Bought by
Kudla Thomas and Kudla Lori
Home Financials for this Owner
Home Financials are based on the most recent Mortgage that was taken out on this home.
Original Mortgage
$115,000
Interest Rate
7.09%
Mortgage Type
Commercial
Purchase Details
Closed on
Sep 1, 1994
Sold by
Fox Nathaniel S and Fox Kristina W
Bought by
Sullivan Richard A and Sullivan Mary H
Purchase Details
Closed on
May 2, 1994
Sold by
Shawmut Bk Ct
Bought by
Lombardo Felix N
Purchase Details
Closed on
Mar 22, 1994
Sold by
Folds Owen Jack
Bought by
Lombard James F
Purchase Details
Closed on
Mar 19, 1987
Sold by
Russo Salvatore S
Bought by
Russo Salvatore S
Create a Home Valuation Report for This Property
The Home Valuation Report is an in-depth analysis detailing your home's value as well as a comparison with similar homes in the area
Home Values in the Area
Average Home Value in this Area
Purchase History
| Date | Buyer | Sale Price | Title Company |
|---|---|---|---|
| Real Prop Solutions Ll | $218,200 | -- | |
| Real Prop Solutions Ll | $218,200 | -- | |
| Kudla Thomas | $120,000 | -- | |
| Kudla Thomas | $120,000 | -- | |
| Sullivan Richard A | $228,000 | -- | |
| Sullivan Richard A | $228,000 | -- | |
| Lombardo Felix N | $47,500 | -- | |
| Lombard James F | $162,000 | -- | |
| Lombard James F | $162,000 | -- | |
| Russo Salvatore S | $70,000 | -- |
Source: Public Records
Mortgage History
| Date | Status | Borrower | Loan Amount |
|---|---|---|---|
| Closed | Russo Salvatore S | $187,500 | |
| Previous Owner | Russo Salvatore S | $115,000 |
Source: Public Records
Tax History Compared to Growth
Tax History
| Year | Tax Paid | Tax Assessment Tax Assessment Total Assessment is a certain percentage of the fair market value that is determined by local assessors to be the total taxable value of land and additions on the property. | Land | Improvement |
|---|---|---|---|---|
| 2025 | $8,782 | $224,140 | $63,350 | $160,790 |
| 2024 | $8,874 | $224,140 | $63,350 | $160,790 |
| 2023 | $8,580 | $224,140 | $63,350 | $160,790 |
| 2022 | $8,462 | $170,940 | $55,580 | $115,360 |
| 2021 | $8,462 | $170,940 | $55,580 | $115,360 |
| 2020 | $8,632 | $170,940 | $55,580 | $115,360 |
| 2019 | $8,632 | $170,940 | $55,580 | $115,360 |
| 2018 | $8,632 | $170,940 | $55,580 | $115,360 |
| 2017 | $8,346 | $165,270 | $52,920 | $112,350 |
| 2016 | $8,346 | $165,270 | $52,920 | $112,350 |
| 2015 | $8,098 | $165,270 | $52,920 | $112,350 |
| 2014 | $8,098 | $165,270 | $52,920 | $112,350 |
Source: Public Records
Map
Nearby Homes
- 43 Westerly St
- 30 Westerly St
- 96 Garden St
- 66 Lincoln St
- 112 Lincoln St
- 817 W Main St
- 212 Lincoln St
- 71 Pennsylvania Ave
- 300 W Main St
- 1467 Corbin Ave
- 108 Overhill Ave
- 23 Ledyard Rd
- 149 Pennsylvania Ave Unit 151
- 1485 Corbin Ave
- 45 Park Place Unit 205
- 300 Lincoln St
- 335 Broad St
- 256 Hart St
- 14 Park Place Unit 4
- 25 Clinton St
- 582 W Main St
- 594 W Main St
- 598 W Main St
- 578 W Main St
- 17 Woodruff Ct Unit 3rd
- 9 Holmes Ave
- 9 Holmes Ave Unit Holmes Avenue New Br
- 29 Woodruff Ct
- 602 W Main St
- 22 Holmes Ave
- 15 Holmes Ave
- 591 - 593 W Main St
- 591 W Main St Unit 593
- 591 W Main St
- 24 Woodruff Ct
- 31 Woodruff Ct
- 21 Holmes Ave
- 30 Woodruff Ct
- 18 Woodruff Ct