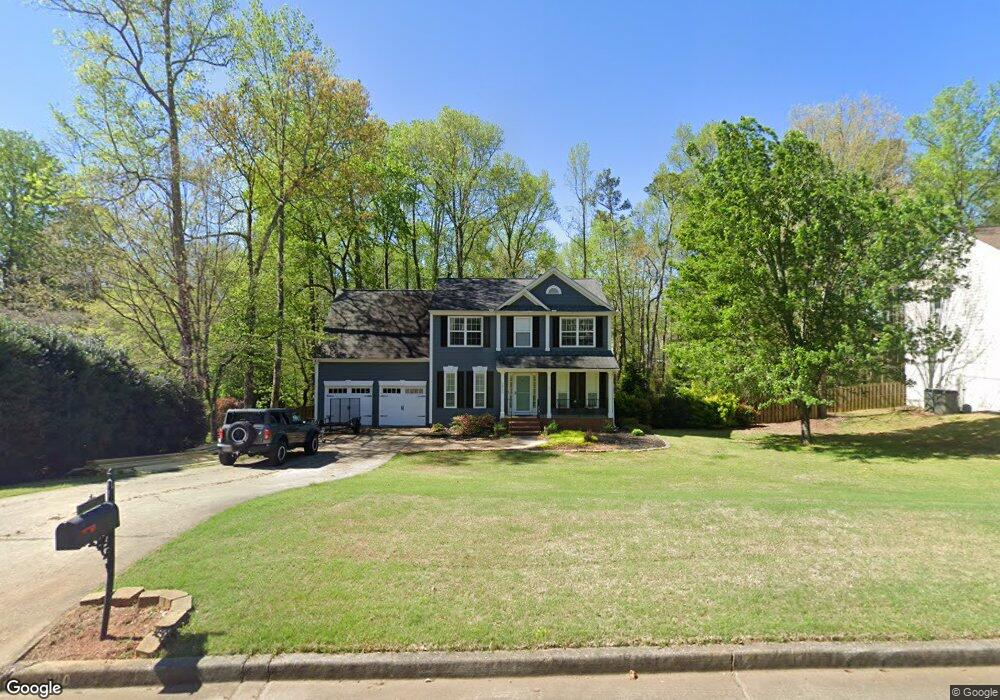
5860 Millstone Dr Cumming, GA 30028
Estimated Value: $433,000 - $450,336
3
Beds
3
Baths
1,957
Sq Ft
$226/Sq Ft
Est. Value
About This Home
This home is located at 5860 Millstone Dr, Cumming, GA 30028 and is currently estimated at $442,084, approximately $225 per square foot. 5860 Millstone Dr is a home located in Forsyth County with nearby schools including Silver City Elementary School, North Forsyth Middle School, and North Forsyth High School.
Ownership History
Date
Name
Owned For
Owner Type
Purchase Details
Closed on
Sep 12, 2011
Sold by
Chavous Lucy Paige
Bought by
Chavous Charles Robert and Chavous Lucy Paige
Current Estimated Value
Purchase Details
Closed on
May 27, 2011
Sold by
Federal Natl Mtg Assn Fnma
Bought by
Chavous Lucy P
Home Financials for this Owner
Home Financials are based on the most recent Mortgage that was taken out on this home.
Original Mortgage
$134,501
Interest Rate
4.62%
Mortgage Type
FHA
Purchase Details
Closed on
Jan 25, 2001
Sold by
D R Horton Inc & Torrey
Bought by
Burgess Byron G and Burgess Valerie D
Home Financials for this Owner
Home Financials are based on the most recent Mortgage that was taken out on this home.
Original Mortgage
$160,167
Interest Rate
7.12%
Mortgage Type
FHA
Create a Home Valuation Report for This Property
The Home Valuation Report is an in-depth analysis detailing your home's value as well as a comparison with similar homes in the area
Home Values in the Area
Average Home Value in this Area
Purchase History
| Date | Buyer | Sale Price | Title Company |
|---|---|---|---|
| Chavous Charles Robert | -- | -- | |
| Chavous Lucy P | $138,000 | -- | |
| Burgess Byron G | $175,000 | -- |
Source: Public Records
Mortgage History
| Date | Status | Borrower | Loan Amount |
|---|---|---|---|
| Previous Owner | Chavous Lucy P | $134,501 | |
| Previous Owner | Burgess Byron G | $160,167 |
Source: Public Records
Tax History Compared to Growth
Tax History
| Year | Tax Paid | Tax Assessment Tax Assessment Total Assessment is a certain percentage of the fair market value that is determined by local assessors to be the total taxable value of land and additions on the property. | Land | Improvement |
|---|---|---|---|---|
| 2025 | $4,560 | $173,000 | $52,000 | $121,000 |
| 2024 | $4,560 | $185,944 | $48,000 | $137,944 |
| 2023 | $4,017 | $163,196 | $36,000 | $127,196 |
| 2022 | $3,492 | $122,392 | $24,000 | $98,392 |
| 2021 | $3,380 | $122,392 | $24,000 | $98,392 |
| 2020 | $2,920 | $105,740 | $20,000 | $85,740 |
| 2019 | $2,784 | $100,684 | $18,000 | $82,684 |
| 2018 | $2,657 | $96,072 | $18,000 | $78,072 |
| 2017 | $2,425 | $87,360 | $18,000 | $69,360 |
| 2016 | $2,052 | $73,944 | $16,000 | $57,944 |
| 2015 | $2,056 | $73,944 | $16,000 | $57,944 |
| 2014 | $1,828 | $69,052 | $16,000 | $53,052 |
Source: Public Records
Map
Nearby Homes
- 5720 Millstone Dr
- 5260 Birch Valley Rd
- 5375 Julep Ct
- 5240 Birch Valley Rd
- 5405 Julep Ct
- 5415 Julep Ct
- 5210 Birch Valley Rd
- 5430 Settingdown Rd
- 5450 Settingdown Rd
- 5470 Settingdown Rd
- 5525 Hubbard Town Rd
- 0 Ga 400 Hwy Unit 10418657
- 5315 Hopewell Manor Dr
- 5030 Mundy Dr
- 4950 Fieldstone View Cir
- 4960 Plainsman Cir
- 4810 Hopewell Manor Dr
- 5270 Mundy Ct
- 5340 Mundy Ct
- 5040 Fieldstone Bend Dr Unit 1
- 5870 Millstone Dr Unit 1A
- 5850 Millstone Dr Unit IA
- 5880 Millstone Dr
- 5880 Millstone Dr
- 5880 Millstone Dr Unit 5880
- 5840 Millstone Dr
- 5855 Millstone Dr
- 5845 Millstone Dr
- 5865 Millstone Dr
- 5835 Millstone Dr
- 5830 Millstone Dr
- 5890 Millstone Dr
- 5725 Hedge Brook Dr
- 5715 Hedge Brook Dr
- 5875 Millstone Dr
- 5705 Hedge Brook Dr
- 5820 Millstone Dr
- 5655 Hedge Brook Dr Unit 5655
- 5825 Millstone Dr
- 5740 Hedge Brook Dr