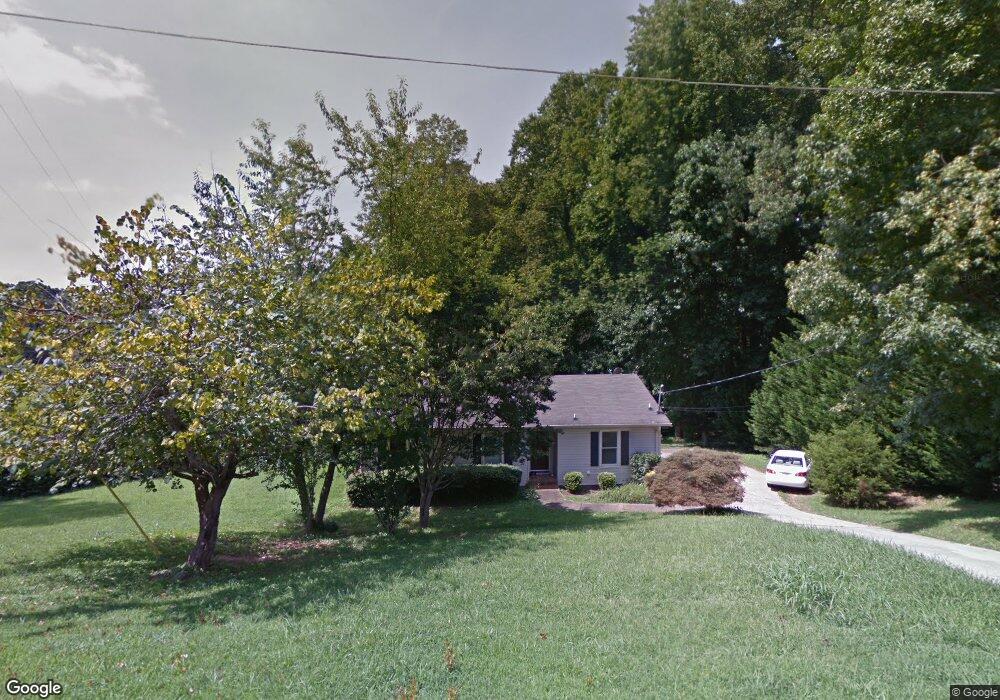
5862 Meadow View Ln Unit N/a Flowery Branch, GA 30542
Estimated Value: $292,927 - $365,000
3
Beds
2
Baths
1,216
Sq Ft
$271/Sq Ft
Est. Value
About This Home
This home is located at 5862 Meadow View Ln Unit N/a, Flowery Branch, GA 30542 and is currently estimated at $329,982, approximately $271 per square foot. 5862 Meadow View Ln Unit N/a is a home located in Hall County with nearby schools including Flowery Branch Elementary School, West Hall Middle School, and West Hall High School.
Ownership History
Date
Name
Owned For
Owner Type
Purchase Details
Closed on
May 25, 2021
Sold by
Amvesco Properties Llc
Bought by
Zimmermann Sue A
Current Estimated Value
Home Financials for this Owner
Home Financials are based on the most recent Mortgage that was taken out on this home.
Original Mortgage
$211,105
Outstanding Balance
$191,129
Interest Rate
2.9%
Mortgage Type
New Conventional
Estimated Equity
$138,853
Purchase Details
Closed on
Jul 21, 2009
Sold by
Fannie Mae
Bought by
Amvesco Properties Llc
Purchase Details
Closed on
Feb 4, 2009
Sold by
Countrywide Hm Loans Servicing
Bought by
Federal National Mortgage Association
Purchase Details
Closed on
Aug 23, 1999
Sold by
Irby Paul H and Irby Tracie A
Bought by
Ferguson Lisa
Home Financials for this Owner
Home Financials are based on the most recent Mortgage that was taken out on this home.
Original Mortgage
$81,288
Interest Rate
7.73%
Mortgage Type
New Conventional
Create a Home Valuation Report for This Property
The Home Valuation Report is an in-depth analysis detailing your home's value as well as a comparison with similar homes in the area
Home Values in the Area
Average Home Value in this Area
Purchase History
| Date | Buyer | Sale Price | Title Company |
|---|---|---|---|
| Zimmermann Sue A | $225,000 | -- | |
| Amvesco Properties Llc | $55,000 | -- | |
| Federal National Mortgage Association | -- | -- | |
| Countrywide Hm Loans Servicing | $94,595 | -- | |
| Ferguson Lisa | $82,000 | -- |
Source: Public Records
Mortgage History
| Date | Status | Borrower | Loan Amount |
|---|---|---|---|
| Open | Zimmermann Sue A | $211,105 | |
| Previous Owner | Ferguson Lisa | $81,288 |
Source: Public Records
Tax History Compared to Growth
Tax History
| Year | Tax Paid | Tax Assessment Tax Assessment Total Assessment is a certain percentage of the fair market value that is determined by local assessors to be the total taxable value of land and additions on the property. | Land | Improvement |
|---|---|---|---|---|
| 2024 | $2,217 | $86,836 | $8,320 | $78,516 |
| 2023 | $2,210 | $86,556 | $8,320 | $78,236 |
| 2022 | $1,593 | $59,036 | $8,320 | $50,716 |
| 2021 | $1,259 | $45,172 | $7,480 | $37,692 |
| 2020 | $1,237 | $43,052 | $7,440 | $35,612 |
| 2019 | $1,074 | $36,692 | $7,440 | $29,252 |
| 2018 | $1,313 | $43,992 | $7,440 | $36,552 |
| 2017 | $1,300 | $43,992 | $7,440 | $36,552 |
| 2016 | $1,270 | $43,996 | $7,444 | $36,552 |
| 2015 | $1,280 | $43,996 | $7,444 | $36,552 |
| 2014 | $1,280 | $43,996 | $7,444 | $36,552 |
Source: Public Records
Map
Nearby Homes
- 5867 Meadow View Ln
- 5837 Meadow View Ln
- 5729 Jim Crow Rd
- 5644 Mohave Ct
- 6024 Park Bay Ct
- 6544 Teal Trail Dr
- 5993 Overby Rd
- 6619 Blue Cove Dr
- 6025 River Oaks Dr
- 6322 Spring Cove Dr
- 5531 Radford Rd
- 6144 Scott Dr
- 6144 Scott Dr Unit 8
- 5573 Ashmoore Ct
- 5581 Ashmoore Ct
- 6409 Eva Rd
- 5585 McEver Rd
- 6026 Jim Crow Rd
- 5381 Gray Birch Bend
- 5862 Meadow View Ln
- 5858 Meadow View Ln
- 5876 Meadow View Ln
- 5884 Meadow View Ln
- 5875 Green Meadow Cir
- 5853 Meadow View Ln
- 5853 Meadow Cir
- 5871 Meadow View Ln
- 5877 Meadow View Ln
- 5855 Meadow Cir
- 5875 Meadow View Ln
- 5876 Green Meadow Cir
- 5873 Meadow View Ln
- 5871 Green Meadow Cir
- 5883 Meadow View Ln
- 5890 Meadow View Ln
- 5857 Meadow Cir
- 5849 Meadow View Ln
- 5887 Meadow Cir
- 5844 Meadow View Ln