Estimated Value: $398,000 - $449,000
4
Beds
2
Baths
1,848
Sq Ft
$236/Sq Ft
Est. Value
About This Home
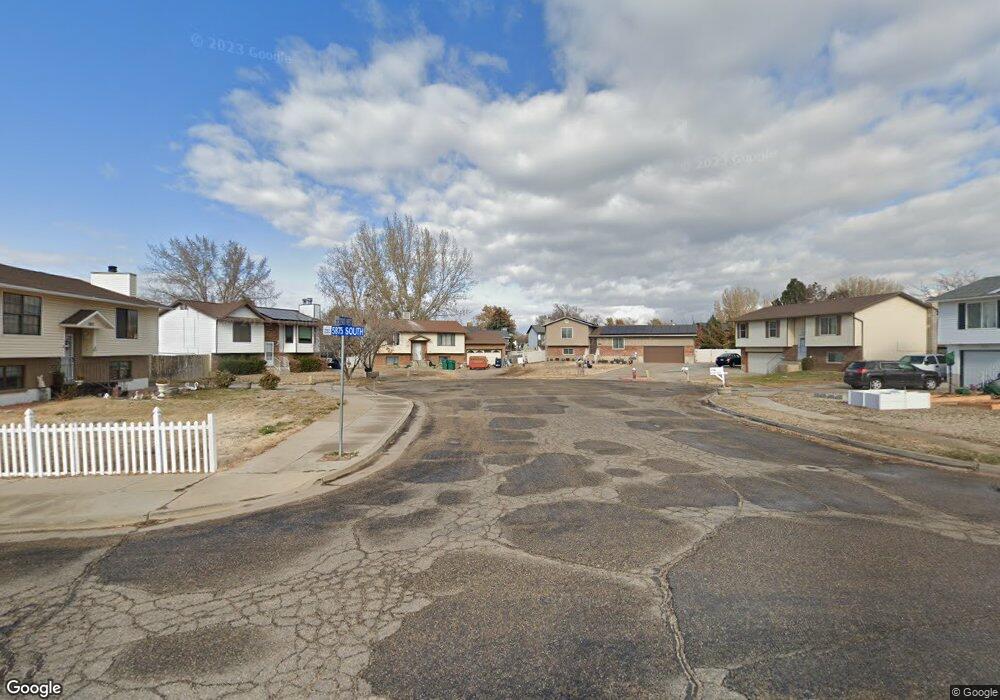
This home is located at 5862 S 2900 W, Roy, UT 84067 and is currently estimated at $435,418, approximately $235 per square foot. 5862 S 2900 W is a home located in Weber County with nearby schools including Roy Elementary School, Roy Junior High School, and Roy High School.
Ownership History
Date
Name
Owned For
Owner Type
Purchase Details
Closed on
Aug 15, 2023
Sold by
Regnier Daniel J
Bought by
Regnier Marietta Fae
Current Estimated Value
Purchase Details
Closed on
May 3, 2021
Sold by
Smith Dale E and Smith Virginia S
Bought by
Regnier Marietta Fae and Regnier Daniel
Home Financials for this Owner
Home Financials are based on the most recent Mortgage that was taken out on this home.
Original Mortgage
$412,392
Interest Rate
3.1%
Mortgage Type
FHA
Create a Home Valuation Report for This Property
The Home Valuation Report is an in-depth analysis detailing your home's value as well as a comparison with similar homes in the area
Home Values in the Area
Average Home Value in this Area
Purchase History
| Date | Buyer | Sale Price | Title Company |
|---|---|---|---|
| Regnier Marietta Fae | -- | Cottonwood Title | |
| Regnier Marietta Fae | -- | None Available |
Source: Public Records
Mortgage History
| Date | Status | Borrower | Loan Amount |
|---|---|---|---|
| Previous Owner | Regnier Marietta Fae | $412,392 |
Source: Public Records
Tax History
| Year | Tax Paid | Tax Assessment Tax Assessment Total Assessment is a certain percentage of the fair market value that is determined by local assessors to be the total taxable value of land and additions on the property. | Land | Improvement |
|---|---|---|---|---|
| 2025 | $2,409 | $377,038 | $128,384 | $248,654 |
| 2024 | $2,353 | $204,049 | $70,626 | $133,423 |
| 2023 | $2,493 | $218,900 | $67,930 | $150,970 |
| 2022 | $2,381 | $213,950 | $57,766 | $156,184 |
| 2021 | $2,005 | $296,000 | $68,670 | $227,330 |
| 2020 | $1,834 | $248,000 | $68,670 | $179,330 |
| 2019 | $1,776 | $226,000 | $42,946 | $183,054 |
| 2018 | $1,637 | $195,000 | $39,932 | $155,068 |
| 2017 | $1,583 | $176,940 | $38,562 | $138,378 |
| 2016 | $1,467 | $87,651 | $19,890 | $67,761 |
| 2015 | $1,317 | $79,930 | $19,890 | $60,040 |
| 2014 | $1,254 | $74,737 | $19,890 | $54,847 |
Source: Public Records
Map
Nearby Homes
Your Personal Tour Guide
Ask me questions while you tour the home.