Estimated Value: $355,000 - $1,304,128
3
Beds
1
Bath
1,254
Sq Ft
$662/Sq Ft
Est. Value
About This Home
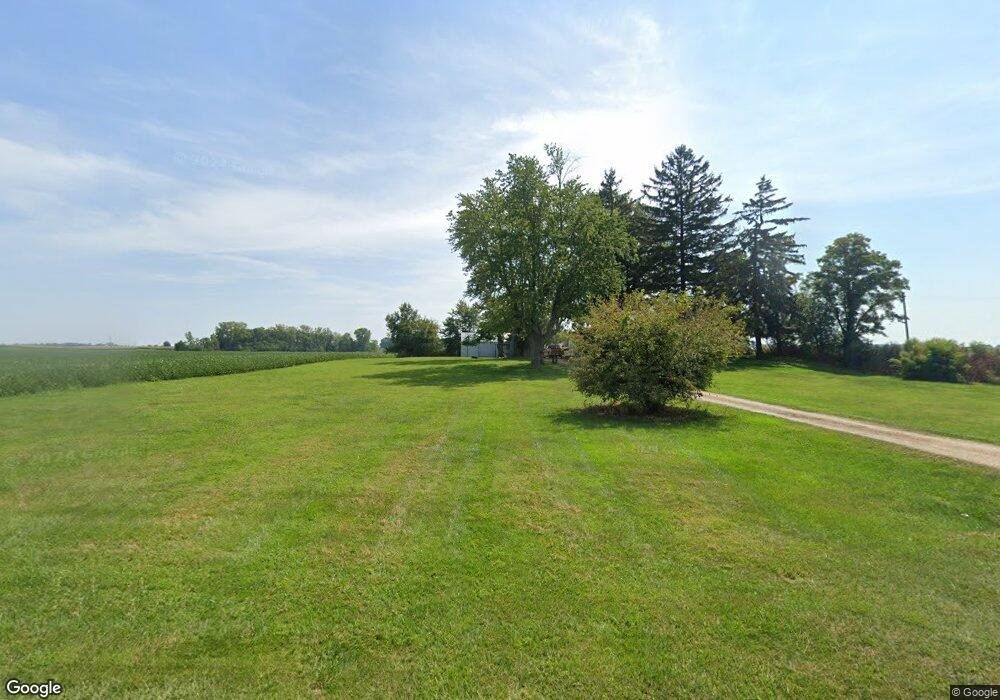
This home is located at 5864 Concord Rd, Eaton, OH 45320 and is currently estimated at $829,564, approximately $661 per square foot. 5864 Concord Rd is a home located in Preble County with nearby schools including Hollingsworth East Elementary School, William Bruce Elementary School, and Eaton Middle School.
Ownership History
Date
Name
Owned For
Owner Type
Purchase Details
Closed on
Feb 26, 2010
Sold by
Caplinger David C and Caplinger Shannon R
Bought by
Shafer Steven M and Shafer Beth Ann
Current Estimated Value
Home Financials for this Owner
Home Financials are based on the most recent Mortgage that was taken out on this home.
Original Mortgage
$251,600
Outstanding Balance
$135,448
Interest Rate
5.11%
Mortgage Type
Purchase Money Mortgage
Estimated Equity
$694,116
Purchase Details
Closed on
Apr 30, 2007
Sold by
Caplinger Beverly
Bought by
Caplinger David C
Purchase Details
Closed on
Aug 3, 2006
Sold by
Caplinger David C
Bought by
Caplinger David C and Caplinger Beverly
Home Financials for this Owner
Home Financials are based on the most recent Mortgage that was taken out on this home.
Original Mortgage
$355,000
Interest Rate
6.82%
Mortgage Type
New Conventional
Create a Home Valuation Report for This Property
The Home Valuation Report is an in-depth analysis detailing your home's value as well as a comparison with similar homes in the area
Home Values in the Area
Average Home Value in this Area
Purchase History
| Date | Buyer | Sale Price | Title Company |
|---|---|---|---|
| Shafer Steven M | $487,500 | Attorney | |
| Caplinger David C | -- | Attorney | |
| Caplinger David C | -- | Freedom Title |
Source: Public Records
Mortgage History
| Date | Status | Borrower | Loan Amount |
|---|---|---|---|
| Open | Shafer Steven M | $251,600 | |
| Previous Owner | Caplinger David C | $355,000 |
Source: Public Records
Tax History Compared to Growth
Tax History
| Year | Tax Paid | Tax Assessment Tax Assessment Total Assessment is a certain percentage of the fair market value that is determined by local assessors to be the total taxable value of land and additions on the property. | Land | Improvement |
|---|---|---|---|---|
| 2024 | $4,033 | $285,070 | $268,760 | $16,310 |
| 2023 | $4,033 | $285,070 | $268,760 | $16,310 |
| 2022 | $2,705 | $61,180 | $50,010 | $11,170 |
| 2021 | $2,838 | $233,210 | $222,040 | $11,170 |
| 2020 | $2,734 | $233,210 | $222,040 | $11,170 |
| 2019 | $4,116 | $222,940 | $211,460 | $11,480 |
| 2018 | $4,249 | $222,940 | $211,460 | $11,480 |
| 2017 | $4,249 | $222,940 | $211,460 | $11,480 |
| 2016 | $4,997 | $187,460 | $177,590 | $9,870 |
| 2014 | $1,326 | $187,500 | $177,630 | $9,870 |
| 2013 | $1,326 | $150,045 | $140,175 | $9,870 |
Source: Public Records
Map
Nearby Homes