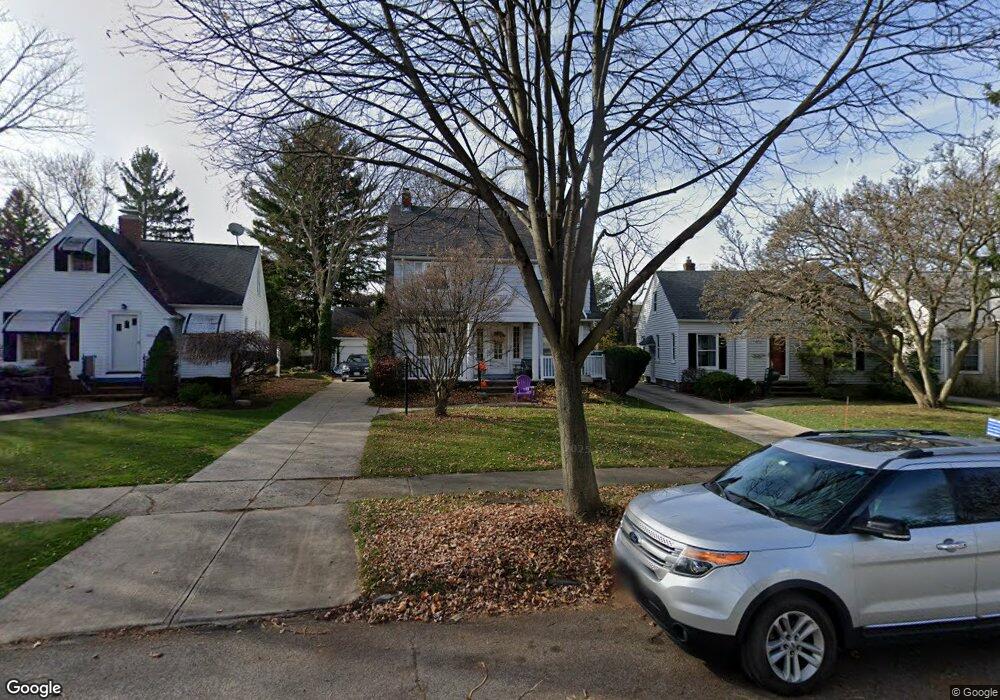
5864 Eldon Dr Parma Heights, OH 44130
Estimated Value: $214,600 - $271,000
3
Beds
2
Baths
1,568
Sq Ft
$152/Sq Ft
Est. Value
About This Home
This home is located at 5864 Eldon Dr, Parma Heights, OH 44130 and is currently estimated at $238,650, approximately $152 per square foot. 5864 Eldon Dr is a home located in Cuyahoga County with nearby schools including Ridge-Brook Elementary School, Greenbriar Middle School, and Valley Forge High School.
Ownership History
Date
Name
Owned For
Owner Type
Purchase Details
Closed on
Aug 24, 2011
Sold by
Massopust Christopher M and Massopust Pamela M
Bought by
Noernberg Ramona
Current Estimated Value
Home Financials for this Owner
Home Financials are based on the most recent Mortgage that was taken out on this home.
Original Mortgage
$110,135
Outstanding Balance
$74,159
Interest Rate
4.37%
Mortgage Type
FHA
Estimated Equity
$164,491
Purchase Details
Closed on
Sep 30, 2003
Sold by
Massopust Christopher M and Volin Mary Kathryn
Bought by
Massopust Christopher M and Massopust Pamela M
Purchase Details
Closed on
Oct 7, 1993
Sold by
Massopust Leo C
Bought by
Massopust Leo C Lf Est
Purchase Details
Closed on
Jul 30, 1987
Sold by
Massopust Leo G and Massopust Eliz M
Bought by
Massopust Leo C
Purchase Details
Closed on
Jan 1, 1975
Bought by
Massopust Leo G and Massopust Eliz M
Create a Home Valuation Report for This Property
The Home Valuation Report is an in-depth analysis detailing your home's value as well as a comparison with similar homes in the area
Home Values in the Area
Average Home Value in this Area
Purchase History
| Date | Buyer | Sale Price | Title Company |
|---|---|---|---|
| Noernberg Ramona | $113,000 | Onnovative | |
| Massopust Christopher M | $65,000 | Real Estate Title | |
| Massopust Leo C Lf Est | -- | -- | |
| Massopust Leo C | -- | -- | |
| Massopust Leo G | -- | -- |
Source: Public Records
Mortgage History
| Date | Status | Borrower | Loan Amount |
|---|---|---|---|
| Open | Noernberg Ramona | $110,135 |
Source: Public Records
Tax History
| Year | Tax Paid | Tax Assessment Tax Assessment Total Assessment is a certain percentage of the fair market value that is determined by local assessors to be the total taxable value of land and additions on the property. | Land | Improvement |
|---|---|---|---|---|
| 2025 | $3,521 | $58,380 | $13,720 | $44,660 |
| 2024 | $3,732 | $58,380 | $13,720 | $44,660 |
| 2023 | $3,836 | $52,570 | $9,730 | $42,840 |
| 2022 | $3,814 | $52,570 | $9,730 | $42,840 |
| 2021 | $3,846 | $52,570 | $9,730 | $42,840 |
| 2020 | $3,462 | $42,390 | $7,840 | $34,550 |
| 2019 | $3,367 | $121,100 | $22,400 | $98,700 |
| 2018 | $3,285 | $42,390 | $7,840 | $34,550 |
| 2017 | $3,212 | $37,800 | $6,930 | $30,870 |
| 2016 | $3,189 | $37,800 | $6,930 | $30,870 |
| 2015 | $3,298 | $37,800 | $6,930 | $30,870 |
| 2014 | $3,298 | $39,380 | $7,210 | $32,170 |
Source: Public Records
Map
Nearby Homes
- 5926 Deering Ave
- 5906 Twin Lakes Dr
- 6041 Creekside Dr
- 0 Parkhill Dr Unit 5116837
- 8012 Spring Garden Rd
- 7814 Bertha Ave
- 8612 W Moreland Rd
- 7923 Jameson Rd
- 8014 Lanyard Dr
- 8325 Kenton Ave
- 7414 Dartworth Dr
- 7610 Renwood Dr
- 8301 Fernhill Ave
- 6220 Denison Blvd
- 5817 Queens Hwy
- 7514 Arden Ave
- 7111 Hampstead Ave
- 7111 Gerald Ave
- 5314 Dartmouth Dr
- 6329 Nelwood Rd
- 5858 Eldon Dr
- 5868 Eldon Dr
- 5854 Eldon Dr
- 5861 Wickfield Dr
- 5867 Wickfield Dr
- 5884 Pearl Rd
- 5848 Eldon Dr
- 5882 Pearl Rd
- 5855 Wickfield Dr
- 5886 Pearl Rd
- 5871 Wickfield Dr
- 5890 Pearl Rd
- 5842 Eldon Dr
- 5876 Pearl Rd
- 5875 Wickfield Dr
- 5845 Wickfield Dr
- 5857 Eldon Dr
- 5894 Pearl Rd
- 5870 Pearl Rd
- 5847 Eldon Dr
Your Personal Tour Guide
Ask me questions while you tour the home.