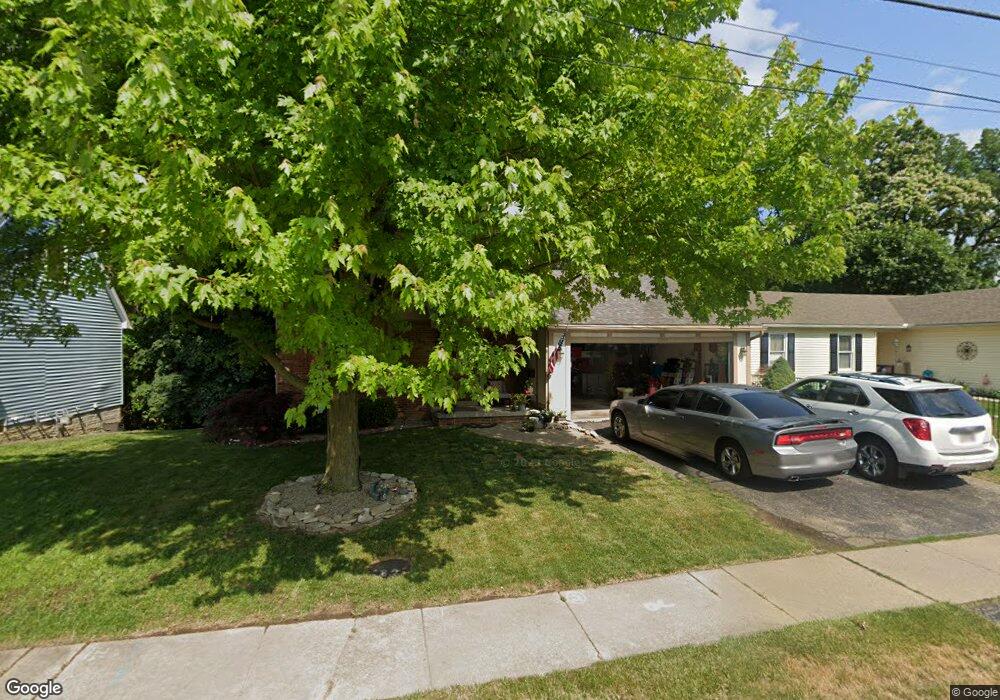
5864 Summit St Sylvania, OH 43560
Estimated Value: $233,000 - $268,000
3
Beds
2
Baths
1,669
Sq Ft
$151/Sq Ft
Est. Value
About This Home
This home is located at 5864 Summit St, Sylvania, OH 43560 and is currently estimated at $251,301, approximately $150 per square foot. 5864 Summit St is a home located in Lucas County with nearby schools including Maplewood Elementary School, Sylvania Arbor Hills Junior High School, and Sylvania Northview High School.
Ownership History
Date
Name
Owned For
Owner Type
Purchase Details
Closed on
Apr 20, 2022
Sold by
Kopko Daniel P
Bought by
Aaron M Frye and Laura M Frye
Current Estimated Value
Home Financials for this Owner
Home Financials are based on the most recent Mortgage that was taken out on this home.
Interest Rate
5%
Purchase Details
Closed on
Apr 15, 2022
Sold by
Kopko Daniel P
Bought by
Frye Aaron M and Frye Laura M
Home Financials for this Owner
Home Financials are based on the most recent Mortgage that was taken out on this home.
Interest Rate
5%
Purchase Details
Closed on
Oct 28, 2004
Sold by
Micham Ray D and Micham Susan L
Bought by
Kopko Daniel P
Home Financials for this Owner
Home Financials are based on the most recent Mortgage that was taken out on this home.
Original Mortgage
$137,200
Interest Rate
5.8%
Mortgage Type
Balloon
Purchase Details
Closed on
Feb 17, 2000
Sold by
Cryan John R
Bought by
Micham Ray D and Micham Susan L
Home Financials for this Owner
Home Financials are based on the most recent Mortgage that was taken out on this home.
Original Mortgage
$100,000
Interest Rate
7.62%
Create a Home Valuation Report for This Property
The Home Valuation Report is an in-depth analysis detailing your home's value as well as a comparison with similar homes in the area
Home Values in the Area
Average Home Value in this Area
Purchase History
| Date | Buyer | Sale Price | Title Company |
|---|---|---|---|
| Aaron M Frye | $205,000 | -- | |
| Frye Aaron M | $205,000 | Hylant Sandra M | |
| Kopko Daniel P | $171,500 | Northwest Title Agency Of Oh | |
| Micham Ray D | $128,000 | Midland |
Source: Public Records
Mortgage History
| Date | Status | Borrower | Loan Amount |
|---|---|---|---|
| Closed | Aaron M Frye | -- | |
| Open | Frye Aaron M | $201,286 | |
| Previous Owner | Kopko Daniel P | $137,200 | |
| Previous Owner | Micham Ray D | $100,000 |
Source: Public Records
Tax History
| Year | Tax Paid | Tax Assessment Tax Assessment Total Assessment is a certain percentage of the fair market value that is determined by local assessors to be the total taxable value of land and additions on the property. | Land | Improvement |
|---|---|---|---|---|
| 2025 | -- | $74,970 | $8,225 | $66,745 |
| 2024 | $2,356 | $74,970 | $8,225 | $66,745 |
| 2023 | $4,411 | $61,145 | $6,930 | $54,215 |
| 2022 | $4,417 | $61,145 | $6,930 | $54,215 |
| 2021 | $4,558 | $61,145 | $6,930 | $54,215 |
| 2020 | $4,526 | $53,970 | $6,090 | $47,880 |
| 2019 | $4,348 | $53,970 | $6,090 | $47,880 |
| 2018 | $4,350 | $53,970 | $6,090 | $47,880 |
| 2017 | $4,130 | $46,690 | $5,985 | $40,705 |
| 2016 | $4,048 | $133,400 | $17,100 | $116,300 |
| 2015 | $3,806 | $133,400 | $17,100 | $116,300 |
| 2014 | $3,547 | $44,870 | $5,740 | $39,130 |
| 2013 | $3,547 | $44,870 | $5,740 | $39,130 |
Source: Public Records
Map
Nearby Homes
- 5814 Summit St
- 5804 Summit St
- 6748 Green Rd
- 6059 Brainard Dr
- 7030 Hickory Ridge Rd
- 6007 Granville Dr
- 5742 Marshall Rd
- 6584 Brint Rd
- 6946 Kinsman Dr
- 6043 Meade Rd
- 6051 Meade Rd
- 6056 Meade Rd
- 6011 Meade Rd
- 6044 Meade Rd
- 6064 Meade Rd
- 6069 Meade Rd
- 6003 Roan Rd
- 4854 Wickford Dr E
- 5707 Roan Rd
- 6022 Roan Rd
- 5858 Summit St
- 5870 Summit St
- 5848 Summit St
- 5859 Summit St
- 5857 Summit St
- 5869 Summit St
- 5851 Summit St
- 5840 Summit St
- 5845 Summit St
- 5903 Summit St
- 5841 Summit St
- 5909 Summit St
- 5832 Summit St
- 5835 Summit St
- 5915 Summit St
- 5826 Summit St
- 5829 Summit St
- 5895 Summit St
- 5902 Colonial Ct
- 5820 Summit St
Your Personal Tour Guide
Ask me questions while you tour the home.