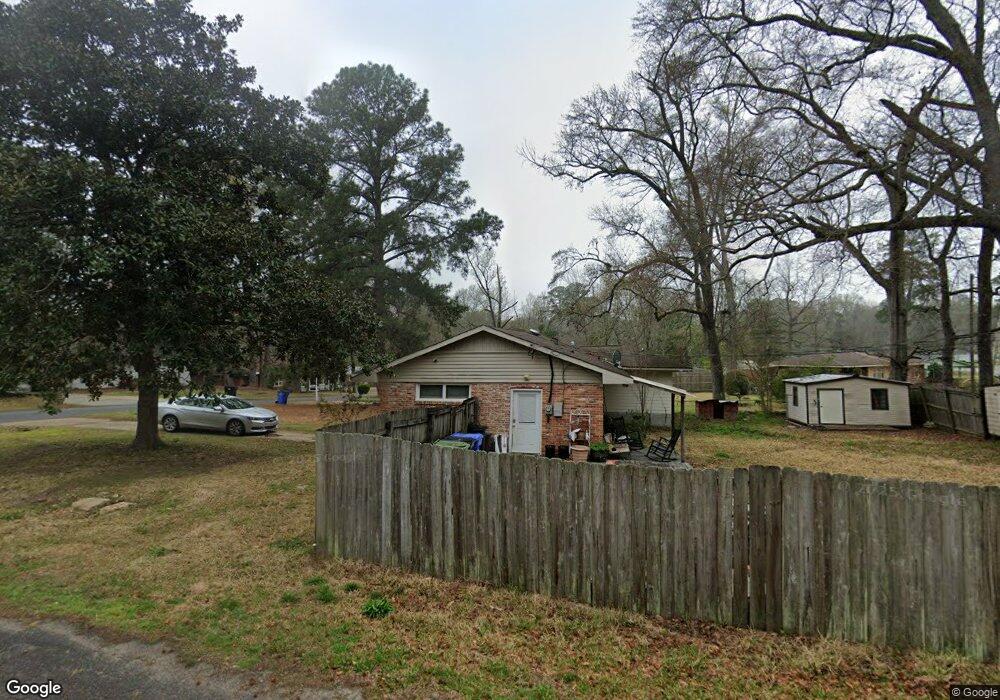
5865 Darral Dr Columbus, GA 31909
Northern Columbus NeighborhoodEstimated Value: $195,000 - $235,000
3
Beds
2
Baths
1,654
Sq Ft
$126/Sq Ft
Est. Value
About This Home
This home is located at 5865 Darral Dr, Columbus, GA 31909 and is currently estimated at $208,665, approximately $126 per square foot. 5865 Darral Dr is a home located in Muscogee County with nearby schools including Gentian Elementary School, Blackmon Road Middle School, and Hardaway High School.
Ownership History
Date
Name
Owned For
Owner Type
Purchase Details
Closed on
Mar 21, 2019
Sold by
Moncus Melissa C
Bought by
Bradshaw Avery
Current Estimated Value
Home Financials for this Owner
Home Financials are based on the most recent Mortgage that was taken out on this home.
Original Mortgage
$116,402
Outstanding Balance
$104,488
Interest Rate
5.5%
Mortgage Type
FHA
Estimated Equity
$104,177
Purchase Details
Closed on
Oct 31, 2013
Sold by
Johnson Jeremy
Bought by
Moncus Melissa C
Home Financials for this Owner
Home Financials are based on the most recent Mortgage that was taken out on this home.
Original Mortgage
$120,555
Interest Rate
4.23%
Mortgage Type
New Conventional
Purchase Details
Closed on
Feb 28, 2007
Sold by
Collins Dane A and Collins Karen E
Bought by
Johnson Jeremy and Taylor Julie
Home Financials for this Owner
Home Financials are based on the most recent Mortgage that was taken out on this home.
Original Mortgage
$122,379
Interest Rate
6.27%
Mortgage Type
FHA
Create a Home Valuation Report for This Property
The Home Valuation Report is an in-depth analysis detailing your home's value as well as a comparison with similar homes in the area
Home Values in the Area
Average Home Value in this Area
Purchase History
| Date | Buyer | Sale Price | Title Company |
|---|---|---|---|
| Bradshaw Avery | $127,000 | -- | |
| Moncus Melissa C | $126,900 | -- | |
| Johnson Jeremy | $124,400 | None Available |
Source: Public Records
Mortgage History
| Date | Status | Borrower | Loan Amount |
|---|---|---|---|
| Open | Bradshaw Avery | $116,402 | |
| Previous Owner | Moncus Melissa C | $120,555 | |
| Previous Owner | Johnson Jeremy | $122,379 |
Source: Public Records
Tax History Compared to Growth
Tax History
| Year | Tax Paid | Tax Assessment Tax Assessment Total Assessment is a certain percentage of the fair market value that is determined by local assessors to be the total taxable value of land and additions on the property. | Land | Improvement |
|---|---|---|---|---|
| 2025 | $113 | $53,088 | $7,932 | $45,156 |
| 2024 | $1,124 | $53,088 | $7,932 | $45,156 |
| 2023 | $437 | $53,088 | $7,932 | $45,156 |
| 2022 | $1,172 | $46,156 | $7,932 | $38,224 |
| 2021 | $1,166 | $41,940 | $7,932 | $34,008 |
| 2020 | $1,166 | $41,940 | $7,932 | $34,008 |
| 2019 | $1,533 | $41,940 | $7,932 | $34,008 |
| 2018 | $1,533 | $41,940 | $7,932 | $34,008 |
| 2017 | $1,540 | $41,940 | $7,932 | $34,008 |
| 2016 | $1,546 | $50,760 | $3,707 | $47,053 |
| 2015 | $1,549 | $50,760 | $3,707 | $47,053 |
| 2014 | $1,551 | $50,760 | $3,707 | $47,053 |
| 2013 | -- | $49,314 | $3,707 | $45,607 |
Source: Public Records
Map
Nearby Homes
- 5915 Frazier Dr
- 5866 Morningside Dr
- 5926 Frazier Dr
- 5921 Lawson St
- 5636 Webb Ave
- 4847 Warm Springs Rd
- 4320 Canady St
- 5224 Miller Rd
- 5623 Hodges Dr
- 6158 Arrington Dr
- 5619 Hodges Dr
- 5621 Hodges Dr
- 4121 Wilbur Dr
- 5829 Moon Rd
- 4454 Weems Rd
- 4036 Wilbur Dr
- 6136 Morningside Dr
- 6104 Candlestick Loop
- 5540 Rodgers Dr
- 5028 Warm Springs Rd
- 5853 Darral Dr
- 4619 Frazier Dr
- 5872 Darral Dr
- 5841 Darral Dr
- 5901 Frazier Dr
- 5900 Frazier Dr
- 5856 Darral Dr
- 5842 Darral Dr
- 4501 Frazier Dr
- 5902 Frazier Dr
- 5835 Darral Dr
- 4462 Desoto Dr
- 5871 Morningside Dr
- 5865 Morningside Dr
- 5840 Darral Dr
- 5825 Darral Dr
- 5906 Frazier Dr
- 4456 Desoto Dr
- 5861 Morningside Dr
- 5903 Morningside Dr