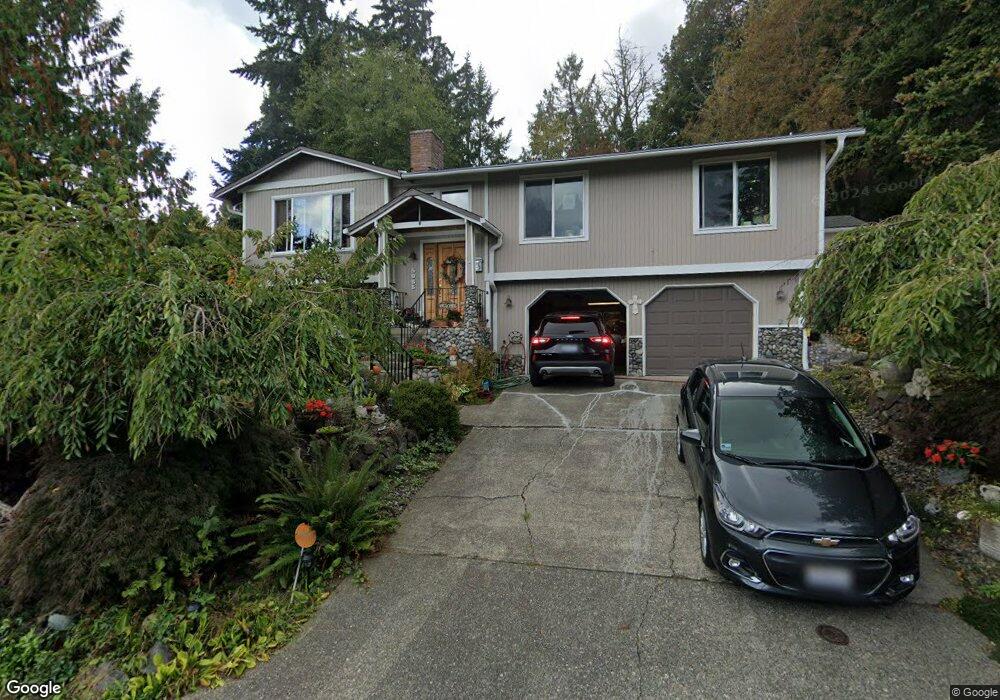
5865 Hardt Ave NE Bremerton, WA 98311
Estimated Value: $516,427 - $562,000
3
Beds
3
Baths
1,890
Sq Ft
$287/Sq Ft
Est. Value
About This Home
This home is located at 5865 Hardt Ave NE, Bremerton, WA 98311 and is currently estimated at $542,857, approximately $287 per square foot. 5865 Hardt Ave NE is a home located in Kitsap County with nearby schools including View Ridge Elementary School, Mountain View Middle School, and Bremerton High School.
Ownership History
Date
Name
Owned For
Owner Type
Purchase Details
Closed on
Oct 13, 2011
Sold by
Benslay Charles W and Benslay Liza E
Bought by
Holbert Walter S and Holbert Dora J
Current Estimated Value
Home Financials for this Owner
Home Financials are based on the most recent Mortgage that was taken out on this home.
Original Mortgage
$202,500
Outstanding Balance
$137,512
Interest Rate
4.01%
Mortgage Type
New Conventional
Estimated Equity
$405,345
Purchase Details
Closed on
Jan 26, 1996
Sold by
Caldwell Carol L
Bought by
Benslay Charles W and Benslay Liza E
Home Financials for this Owner
Home Financials are based on the most recent Mortgage that was taken out on this home.
Original Mortgage
$118,320
Interest Rate
7.25%
Mortgage Type
Assumption
Create a Home Valuation Report for This Property
The Home Valuation Report is an in-depth analysis detailing your home's value as well as a comparison with similar homes in the area
Home Values in the Area
Average Home Value in this Area
Purchase History
| Date | Buyer | Sale Price | Title Company |
|---|---|---|---|
| Holbert Walter S | $3,539 | Pacific Nw Title | |
| Benslay Charles W | $116,000 | Land Title Company |
Source: Public Records
Mortgage History
| Date | Status | Borrower | Loan Amount |
|---|---|---|---|
| Open | Holbert Walter S | $202,500 | |
| Previous Owner | Benslay Charles W | $118,320 |
Source: Public Records
Tax History Compared to Growth
Tax History
| Year | Tax Paid | Tax Assessment Tax Assessment Total Assessment is a certain percentage of the fair market value that is determined by local assessors to be the total taxable value of land and additions on the property. | Land | Improvement |
|---|---|---|---|---|
| 2026 | $4,457 | $451,300 | $101,240 | $350,060 |
| 2025 | $4,457 | $451,300 | $101,240 | $350,060 |
| 2024 | $4,305 | $451,300 | $101,240 | $350,060 |
| 2023 | $4,318 | $451,300 | $101,240 | $350,060 |
| 2022 | $4,047 | $374,140 | $83,670 | $290,470 |
| 2021 | $3,868 | $335,760 | $61,860 | $273,900 |
| 2020 | $3,544 | $317,770 | $58,370 | $259,400 |
| 2019 | $3,220 | $286,330 | $52,710 | $233,620 |
| 2018 | $3,547 | $236,900 | $43,560 | $193,340 |
| 2017 | $3,194 | $236,900 | $43,560 | $193,340 |
| 2016 | $3,048 | $214,570 | $38,900 | $175,670 |
| 2015 | $2,802 | $201,710 | $43,090 | $158,620 |
| 2014 | -- | $191,880 | $43,090 | $148,790 |
| 2013 | -- | $191,880 | $43,090 | $148,790 |
Source: Public Records
Map
Nearby Homes
- 3532 NE Shore Cliff St
- 5503 Fern Ave NE
- 5600 Oceanview Blvd NE
- 6305 Rest Place NE
- 5208 Illahee Rd NE
- 3744 NE Trout Brook Ln
- 3840 NE Ambleside Ln
- 3 Illahee Rd NE
- 3060 NE Mcwilliams Rd Unit 104
- 3060 NE Mcwilliams Rd Unit 124
- 3060 NE Mcwilliams Rd Unit 9
- 3703 NE Trout Brook Ln
- 3709 NE Liverpool Dr
- 2940 Osiris Ct NE
- 3467 Partridge Hollow NE
- 2348 NE Windsor Ct
- 0 University Point Cir NE
- 7265 Thasos Ave NE
- 7550 Varsity Ln NE
- 36 Illahee Rd NE
- 5861 Hardt Ave NE
- 5990 Oceanview Blvd NE
- 3491 NE Shore Cliff St
- 5868 Hardt Ave NE
- 3497 NE Shore Cliff St
- 3489 NE Shore Cliff St
- 5864 Hardt Ave NE
- 3503 NE Shore Cliff St
- 5838 School St NE
- 5991 Fern Ave NE
- 5939 Oceanview Blvd NE
- 3479 NE Shore Cliff St
- 5961 Fern Ave NE
- 5860 Hardt Ave NE
- 3509 NE Shore Cliff St
- 3492 NE Shore Cliff St
- 5929 Fern Ave NE
- 3498 NE Shore Cliff St
- 5832 School St NE
- 3473 NE Shore Cliff St