Estimated Value: $474,000 - $505,000
5
Beds
3
Baths
2,025
Sq Ft
$241/Sq Ft
Est. Value
About This Home
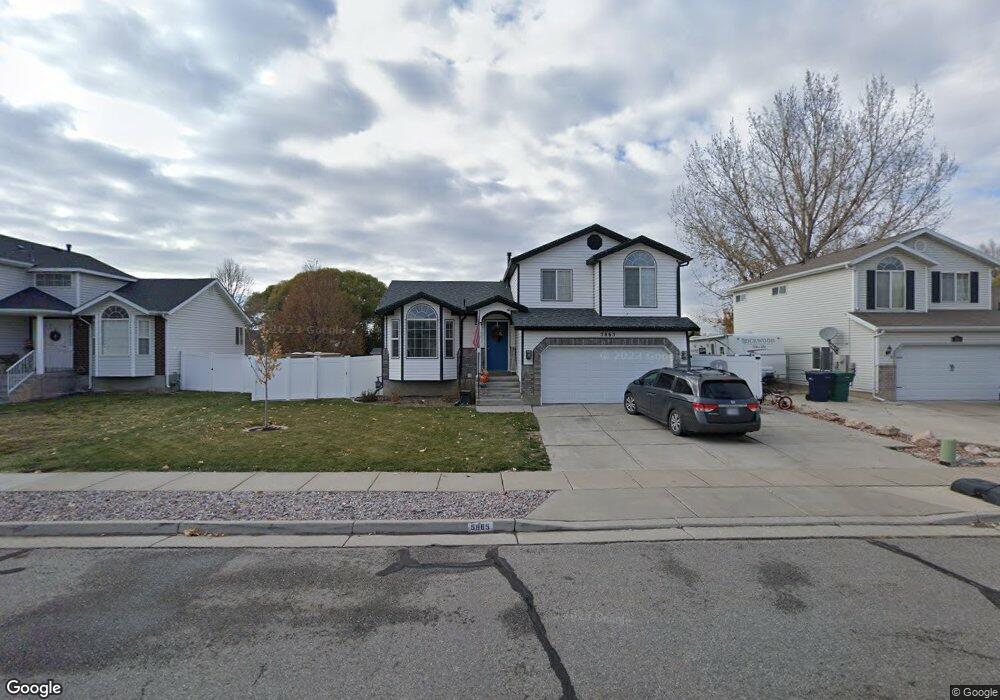
This home is located at 5865 S 3325 W, Roy, UT 84067 and is currently estimated at $487,058, approximately $240 per square foot. 5865 S 3325 W is a home located in Weber County with nearby schools including Municipal School, Roy Junior High School, and Roy High School.
Ownership History
Date
Name
Owned For
Owner Type
Purchase Details
Closed on
Jun 28, 2018
Sold by
Burke Susan and Estate Of Quoc Van Hoang
Bought by
Olsen Brian Robert and Olsen Brittney Christian
Current Estimated Value
Home Financials for this Owner
Home Financials are based on the most recent Mortgage that was taken out on this home.
Original Mortgage
$220,000
Outstanding Balance
$191,084
Interest Rate
4.6%
Mortgage Type
New Conventional
Estimated Equity
$295,974
Purchase Details
Closed on
Mar 19, 2010
Sold by
Hoang Quoc and Ho Van Thikim
Bought by
Hoang Quoc
Purchase Details
Closed on
Jul 29, 2004
Sold by
Pham Sang V and Joseph Joanne
Bought by
Hoang Quoc and Ho Van Thikim
Home Financials for this Owner
Home Financials are based on the most recent Mortgage that was taken out on this home.
Original Mortgage
$100,000
Interest Rate
6.29%
Mortgage Type
Purchase Money Mortgage
Purchase Details
Closed on
Jun 12, 2003
Sold by
Pham Sang V
Bought by
Pham Sang and Joseph Joanne
Home Financials for this Owner
Home Financials are based on the most recent Mortgage that was taken out on this home.
Original Mortgage
$123,000
Interest Rate
4.76%
Mortgage Type
Purchase Money Mortgage
Purchase Details
Closed on
Jul 29, 1999
Sold by
Becker Jeff and Becker Aneshia
Bought by
Pham Sang and Joseph Joanne
Home Financials for this Owner
Home Financials are based on the most recent Mortgage that was taken out on this home.
Original Mortgage
$122,597
Interest Rate
7.64%
Mortgage Type
FHA
Purchase Details
Closed on
Jan 4, 1999
Sold by
Nilson & Company Inc
Bought by
Becker Jeff and Becker Aneshia
Home Financials for this Owner
Home Financials are based on the most recent Mortgage that was taken out on this home.
Original Mortgage
$130,266
Interest Rate
6.82%
Mortgage Type
FHA
Purchase Details
Closed on
Aug 7, 1998
Sold by
Nilson & Company Inc
Bought by
Becker Jeff and Becker Aneshia
Home Financials for this Owner
Home Financials are based on the most recent Mortgage that was taken out on this home.
Original Mortgage
$105,500
Interest Rate
6.93%
Create a Home Valuation Report for This Property
The Home Valuation Report is an in-depth analysis detailing your home's value as well as a comparison with similar homes in the area
Home Values in the Area
Average Home Value in this Area
Purchase History
| Date | Buyer | Sale Price | Title Company |
|---|---|---|---|
| Olsen Brian Robert | -- | North American Title | |
| Hoang Quoc | -- | Accommodation | |
| Hoang Quoc | -- | Bonneville Title | |
| Pham Sang | -- | First National Title | |
| Pham Sang | -- | First National Title | |
| Pham Sang | -- | Associated Title | |
| Becker Jeff | -- | Bonneville Title Company | |
| Becker Jeff | -- | Bonneville Title Company |
Source: Public Records
Mortgage History
| Date | Status | Borrower | Loan Amount |
|---|---|---|---|
| Open | Olsen Brian Robert | $220,000 | |
| Previous Owner | Hoang Quoc | $100,000 | |
| Previous Owner | Pham Sang | $123,000 | |
| Previous Owner | Pham Sang | $122,597 | |
| Previous Owner | Becker Jeff | $130,266 | |
| Previous Owner | Becker Jeff | $105,500 |
Source: Public Records
Tax History Compared to Growth
Tax History
| Year | Tax Paid | Tax Assessment Tax Assessment Total Assessment is a certain percentage of the fair market value that is determined by local assessors to be the total taxable value of land and additions on the property. | Land | Improvement |
|---|---|---|---|---|
| 2025 | $2,921 | $468,447 | $127,693 | $340,754 |
| 2024 | $2,848 | $252,999 | $70,156 | $182,843 |
| 2023 | $2,981 | $267,300 | $70,156 | $197,144 |
| 2022 | $2,991 | $275,550 | $59,475 | $216,075 |
| 2021 | $2,361 | $356,000 | $83,609 | $272,391 |
| 2020 | $2,192 | $303,000 | $83,609 | $219,391 |
| 2019 | $2,100 | $273,000 | $48,835 | $224,165 |
| 2018 | $1,921 | $234,000 | $45,878 | $188,122 |
| 2017 | $1,761 | $200,000 | $45,000 | $155,000 |
| 2016 | $1,727 | $105,664 | $24,041 | $81,623 |
| 2015 | $1,489 | $92,236 | $21,371 | $70,865 |
| 2014 | $1,360 | $82,335 | $21,371 | $60,964 |
Source: Public Records
Map
Nearby Homes