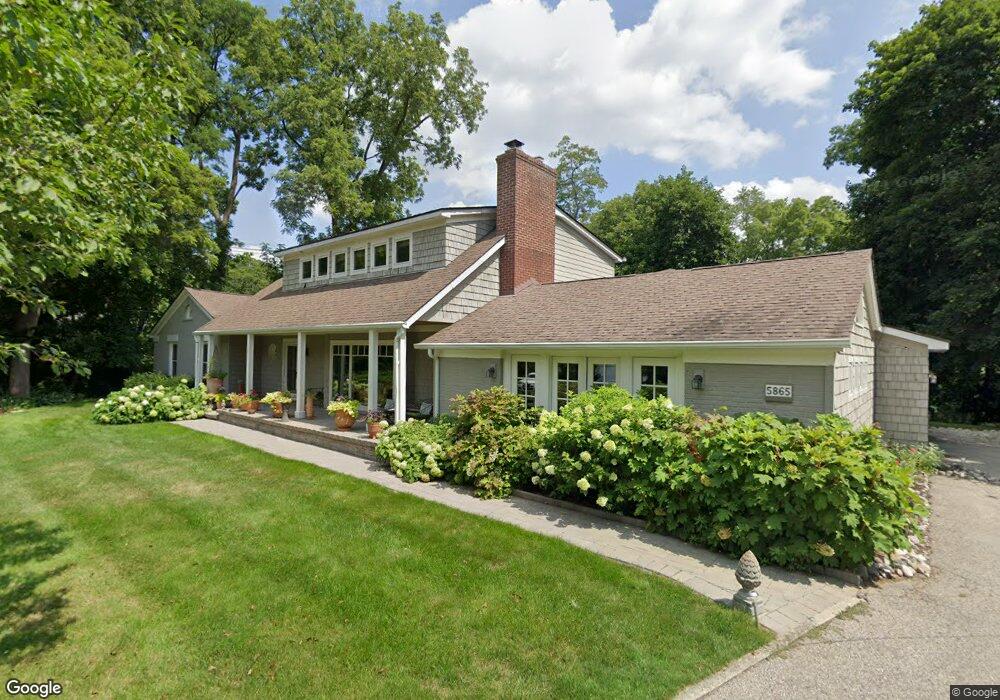
5865 Wingcroft Ct Bloomfield Hills, MI 48301
Estimated Value: $945,043 - $1,805,000
5
Beds
4
Baths
3,455
Sq Ft
$368/Sq Ft
Est. Value
About This Home
This home is located at 5865 Wingcroft Ct, Bloomfield Hills, MI 48301 and is currently estimated at $1,270,761, approximately $367 per square foot. 5865 Wingcroft Ct is a home located in Oakland County with nearby schools including Conant Elementary School, South Hills Middle School, and Bloomfield Hills High School.
Ownership History
Date
Name
Owned For
Owner Type
Purchase Details
Closed on
May 5, 2017
Sold by
Kabel Gerald J and Dare Kabel C
Bought by
Arida Charles and Arida Charles L
Current Estimated Value
Purchase Details
Closed on
Aug 17, 2015
Sold by
Tardella Joseph and Tardella Sally Schluter
Bought by
Sally Tardella Revocable Trust and Tardella Joseph J
Purchase Details
Closed on
Dec 9, 2004
Sold by
Strohmeyer John T and Strohmeyer Julie A
Bought by
Tardella Joseph and Tardella Sally Schluter
Purchase Details
Closed on
Nov 30, 1998
Sold by
Cooper Robert W
Bought by
Strohmeyer John T
Create a Home Valuation Report for This Property
The Home Valuation Report is an in-depth analysis detailing your home's value as well as a comparison with similar homes in the area
Home Values in the Area
Average Home Value in this Area
Purchase History
| Date | Buyer | Sale Price | Title Company |
|---|---|---|---|
| Arida Charles | $395,000 | None Available | |
| Sally Tardella Revocable Trust | -- | Attorney | |
| Tardella Joseph | $685,000 | Devon Title Agency | |
| Strohmeyer John T | -- | -- |
Source: Public Records
Tax History Compared to Growth
Tax History
| Year | Tax Paid | Tax Assessment Tax Assessment Total Assessment is a certain percentage of the fair market value that is determined by local assessors to be the total taxable value of land and additions on the property. | Land | Improvement |
|---|---|---|---|---|
| 2024 | $5,459 | $396,610 | $0 | $0 |
| 2023 | $5,283 | $356,360 | $0 | $0 |
| 2022 | $10,139 | $335,200 | $0 | $0 |
| 2021 | $9,856 | $324,390 | $0 | $0 |
| 2020 | $4,832 | $301,250 | $0 | $0 |
| 2019 | $9,275 | $289,660 | $0 | $0 |
| 2018 | $9,317 | $291,080 | $0 | $0 |
| 2017 | $9,250 | $283,360 | $0 | $0 |
| 2016 | $9,268 | $270,570 | $0 | $0 |
| 2015 | -- | $264,340 | $0 | $0 |
| 2014 | -- | $242,070 | $0 | $0 |
| 2011 | -- | $240,260 | $0 | $0 |
Source: Public Records
Map
Nearby Homes
- 6160 Worlington Rd
- 5630 S Adams Way
- 4065 Justin Ct
- 5584 N Adams Way
- 4088 Cranbrook Ct Unit 34
- 1360 Trailwood Path Unit 76
- 4200 Surrey Cross
- 450 Billingsgate Ct Unit C
- 1760 Trailwood Path
- 5799 Blandford New Build
- 5626 Shadow Ln
- 5799 Blandford Ct
- 4000 Overlea Ct
- 6287 Thorncrest Dr
- 6572 Spruce Dr
- 4456 W Maple Rd
- 5340 Franklin Rd
- 5100 Kings Gate Way
- 1651 Hoit Tower Dr
- 6360 Hills Dr
- 5875 Wingcroft Ct
- 4261 Carey Ln
- 5855 Wingcroft Ct
- 5885 Wing Lake Rd
- 4247 Carey Ln
- 4235 Carey Ln
- 5841 Wing Lake Rd
- 4244 Carey Ln
- 5760 Monterey Ct
- 4260 Carey Ln
- 5904 Wing Lake Rd
- 5750 Monterey Ct
- 5955 Wing Lake Rd
- 4250 Sandy Ln
- 4217 Carey Ln
- 4260 Sandy Ln
- 5770 Monterey Ct
- 4274 Carey Ln
- 5965 Wing Lake Rd
- 4234 Carey Ln