Estimated Value: $227,708 - $233,000
3
Beds
2
Baths
1,384
Sq Ft
$167/Sq Ft
Est. Value
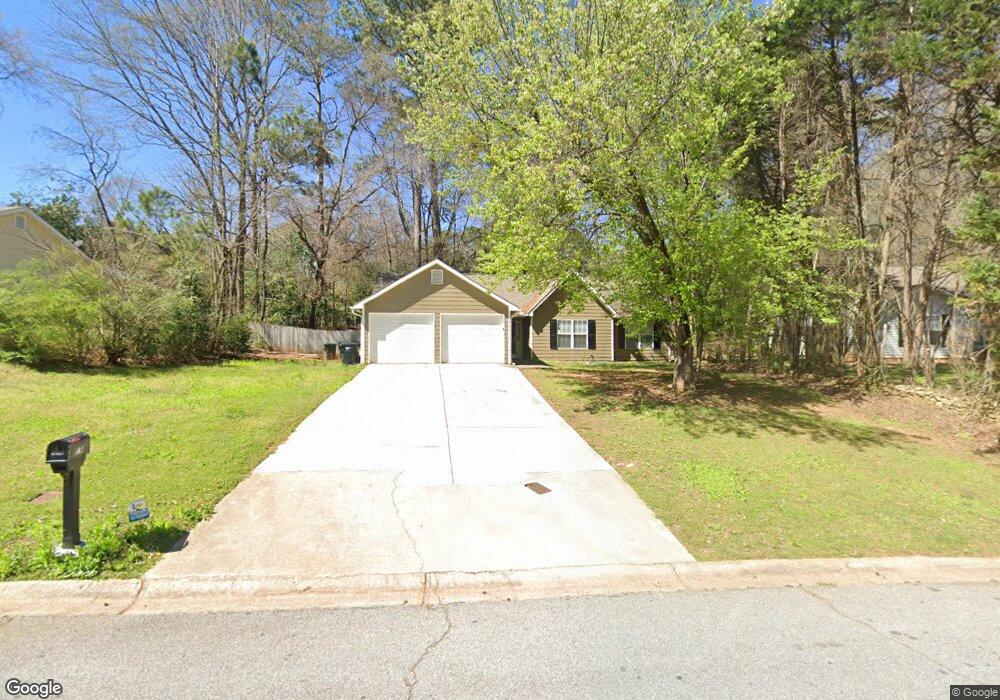
About This Home
This home is located at 5866 Homestead Cir, Rex, GA 30273 and is currently estimated at $230,677, approximately $166 per square foot. 5866 Homestead Cir is a home located in Clayton County with nearby schools including Roberta T. Smith Elementary School, Adamson Middle School, and Morrow High School.
Ownership History
Date
Name
Owned For
Owner Type
Purchase Details
Closed on
Jul 15, 2022
Sold by
Osborne Rosetta
Bought by
Residential Home Buyer E Atlanta Llc
Current Estimated Value
Home Financials for this Owner
Home Financials are based on the most recent Mortgage that was taken out on this home.
Original Mortgage
$249,203
Outstanding Balance
$243,680
Interest Rate
5.78%
Mortgage Type
Mortgage Modification
Estimated Equity
-$13,003
Purchase Details
Closed on
May 5, 2009
Sold by
Kemp David A
Bought by
Homesales Inc
Purchase Details
Closed on
Jul 20, 2008
Sold by
Homesales Inc
Bought by
Osborne Rosetta
Purchase Details
Closed on
Apr 3, 1998
Sold by
Thompson Kristin A and Aretz Jonathan
Bought by
Kemp David A and Kemp Johnnie L
Home Financials for this Owner
Home Financials are based on the most recent Mortgage that was taken out on this home.
Original Mortgage
$78,221
Interest Rate
7.14%
Mortgage Type
FHA
Create a Home Valuation Report for This Property
The Home Valuation Report is an in-depth analysis detailing your home's value as well as a comparison with similar homes in the area
Home Values in the Area
Average Home Value in this Area
Purchase History
| Date | Buyer | Sale Price | Title Company |
|---|---|---|---|
| Residential Home Buyer E Atlanta Llc | $228,000 | -- | |
| Homesales Inc | $23,518 | -- | |
| Osborne Rosetta | $33,000 | -- | |
| Kemp David A | $85,000 | -- |
Source: Public Records
Mortgage History
| Date | Status | Borrower | Loan Amount |
|---|---|---|---|
| Open | Residential Home Buyer E Atlanta Llc | $249,203 | |
| Previous Owner | Kemp David A | $78,221 |
Source: Public Records
Tax History Compared to Growth
Tax History
| Year | Tax Paid | Tax Assessment Tax Assessment Total Assessment is a certain percentage of the fair market value that is determined by local assessors to be the total taxable value of land and additions on the property. | Land | Improvement |
|---|---|---|---|---|
| 2024 | $3,627 | $92,960 | $7,200 | $85,760 |
| 2023 | $3,122 | $86,480 | $7,200 | $79,280 |
| 2022 | $2,323 | $59,200 | $7,200 | $52,000 |
| 2021 | $1,804 | $45,680 | $7,200 | $38,480 |
| 2020 | $1,808 | $45,194 | $7,200 | $37,994 |
| 2019 | $1,734 | $42,715 | $5,600 | $37,115 |
| 2018 | $1,355 | $33,389 | $5,600 | $27,789 |
| 2017 | $1,126 | $27,677 | $5,600 | $22,077 |
| 2016 | $1,070 | $26,304 | $5,600 | $20,704 |
| 2015 | $1,052 | $0 | $0 | $0 |
| 2014 | $974 | $24,496 | $5,600 | $18,896 |
Source: Public Records
Map
Nearby Homes
- 5847 Pinetree Ln
- 3874 Rex Cir
- 3821 Rex Mill Square
- 3694 Rex Rd
- 5861 Colonnade Dr
- 5904 Foxfield Trail
- 3709 Charlotte Dr
- 5810 Mistyview Dr Unit 3
- 6324 Amberly Rd
- 6057 Dorchester Dr
- 3548 Meadowview Ct
- The Brookwood Plan at Legacy at Stagecoach
- The Northview Plan at Legacy at Stagecoach
- The Thorton Plan at Legacy at Stagecoach
- The Lancaster Plan at Legacy at Stagecoach
- The Chadwick Plan at Legacy at Stagecoach
- The Yorkshire Plan at Legacy at Stagecoach
- The Donovan Plan at Legacy at Stagecoach
- The Cheshire Plan at Legacy at Stagecoach
- 3645 Fay Dr Unit 1
- 5870 Homestead Cir
- 3891 Rex Rd
- 5880 Homestead Ct
- 5874 Homestead Cir
- 5871 Homestead Cir
- 5888 Homestead Ct
- 5863 Homestead Cir
- 3899 Rex Rd
- 3899 Rex Rd
- 5877 Homestead Cir
- 5902 Homestead Ct
- 5847 Pinetree Ln Unit 5847
- 0 Homestead Ct Unit 7502601
- 0 Homestead Ct Unit 8704194
- LOT 17 Rex Rd Unit LN LOT 17
- LOT 11 Rex Rd Unit LN LOT 11
- LOT 16 Rex Rd Unit LN LOT 16
- LOT 15 Rex Rd Unit LN LOT 15
- LOT 13 Rex Rd Unit LN LOT 13
- LOT 14 Rex Rd Unit LN LOT 14