Estimated Value: $360,000 - $390,000
3
Beds
1
Bath
1,376
Sq Ft
$276/Sq Ft
Est. Value
About This Home
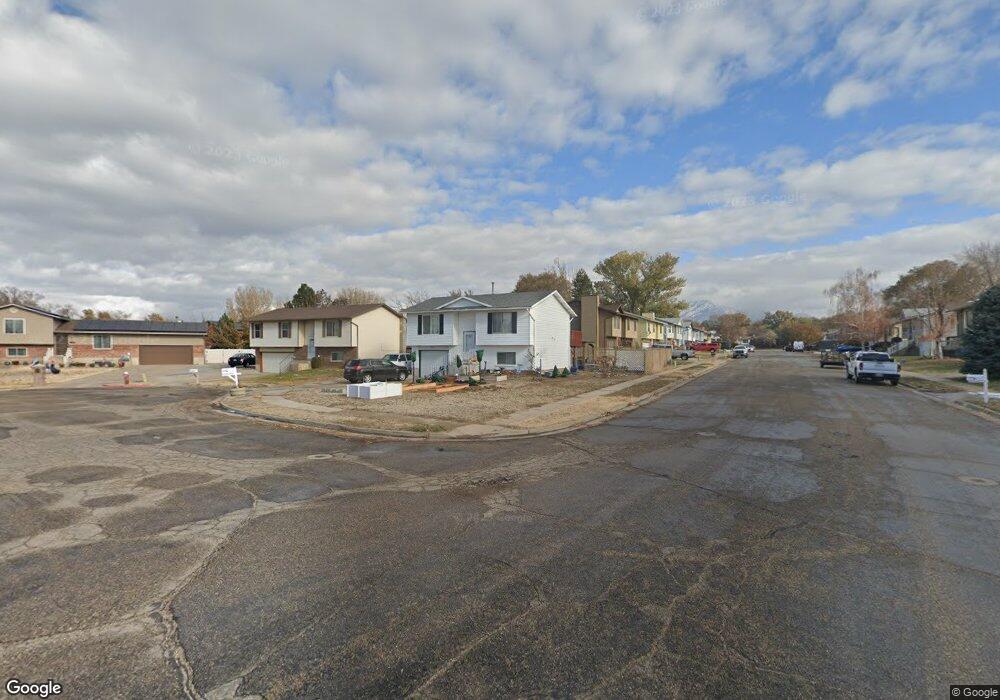
This home is located at 5866 S 2900 W, Roy, UT 84067 and is currently estimated at $379,246, approximately $275 per square foot. 5866 S 2900 W is a home located in Weber County with nearby schools including Roy Elementary School, Roy Junior High School, and Roy High School.
Ownership History
Date
Name
Owned For
Owner Type
Purchase Details
Closed on
Jan 6, 2025
Sold by
Landeros Aurelio and Landeros Miriam
Bought by
Landeros Aurelio
Current Estimated Value
Home Financials for this Owner
Home Financials are based on the most recent Mortgage that was taken out on this home.
Original Mortgage
$306,267
Outstanding Balance
$304,140
Interest Rate
6.81%
Mortgage Type
FHA
Estimated Equity
$75,106
Purchase Details
Closed on
Apr 22, 2013
Sold by
Briggs David G and Briggs Vicki L
Bought by
Schild Fred and Schild Stella M
Create a Home Valuation Report for This Property
The Home Valuation Report is an in-depth analysis detailing your home's value as well as a comparison with similar homes in the area
Home Values in the Area
Average Home Value in this Area
Purchase History
| Date | Buyer | Sale Price | Title Company |
|---|---|---|---|
| Landeros Aurelio | -- | Us Title | |
| Landeros Aurelio | -- | Us Title | |
| Schild Fred | -- | First American Title Company |
Source: Public Records
Mortgage History
| Date | Status | Borrower | Loan Amount |
|---|---|---|---|
| Open | Landeros Aurelio | $306,267 | |
| Closed | Landeros Aurelio | $306,267 |
Source: Public Records
Tax History Compared to Growth
Tax History
| Year | Tax Paid | Tax Assessment Tax Assessment Total Assessment is a certain percentage of the fair market value that is determined by local assessors to be the total taxable value of land and additions on the property. | Land | Improvement |
|---|---|---|---|---|
| 2025 | $2,200 | $341,373 | $120,000 | $221,373 |
| 2024 | $2,150 | $184,799 | $66,014 | $118,785 |
| 2023 | $2,262 | $196,900 | $65,864 | $131,036 |
| 2022 | $2,120 | $188,650 | $55,008 | $133,642 |
| 2021 | $1,962 | $290,000 | $65,022 | $224,978 |
| 2020 | $1,683 | $226,000 | $65,022 | $160,978 |
| 2019 | $1,645 | $208,000 | $40,002 | $167,998 |
| 2018 | $1,470 | $173,000 | $37,050 | $135,950 |
| 2017 | $1,396 | $153,570 | $35,979 | $117,591 |
| 2016 | $1,326 | $78,125 | $19,214 | $58,911 |
| 2015 | $1,178 | $70,277 | $19,214 | $51,063 |
| 2014 | $1,132 | $66,352 | $19,214 | $47,138 |
Source: Public Records
Map
Nearby Homes