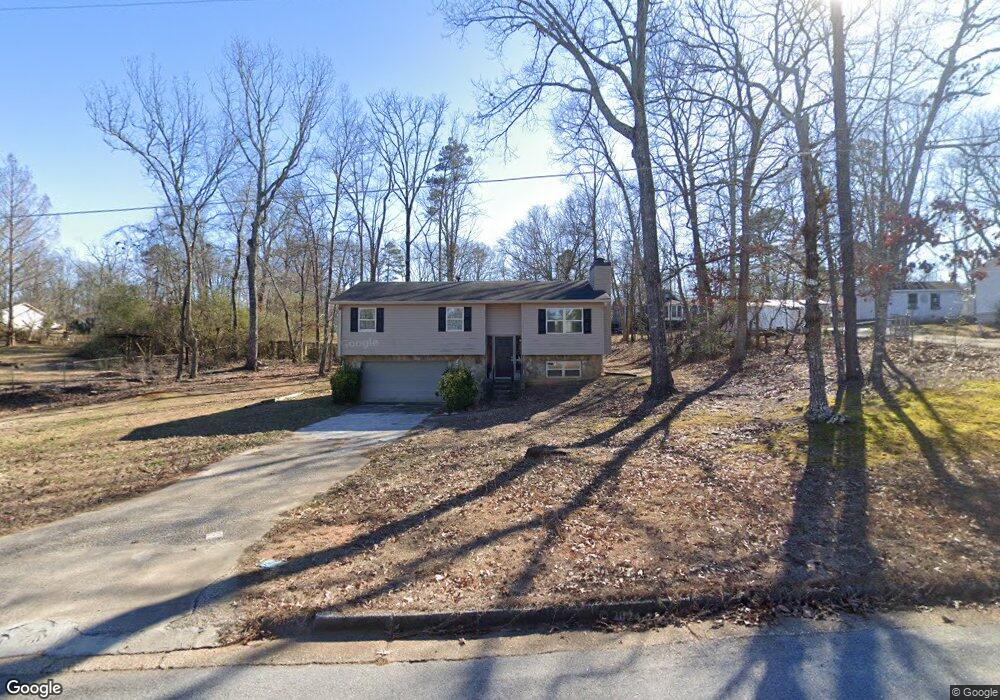
5869 Oak Ct Douglasville, GA 30135
Anneewakee NeighborhoodEstimated Value: $226,000 - $254,000
3
Beds
3
Baths
1,082
Sq Ft
$224/Sq Ft
Est. Value
About This Home
This home is located at 5869 Oak Ct, Douglasville, GA 30135 and is currently estimated at $242,483, approximately $224 per square foot. 5869 Oak Ct is a home located in Douglas County with nearby schools including Dorsett Shoals Elementary School, Yeager Middle School, and Chapel Hill High School.
Ownership History
Date
Name
Owned For
Owner Type
Purchase Details
Closed on
Dec 27, 2010
Sold by
Argo Grant
Bought by
Dga Rentals Llc
Current Estimated Value
Purchase Details
Closed on
Mar 9, 2010
Sold by
Wells Farbo Bk 2003-Opt1
Bought by
Argo Grant
Purchase Details
Closed on
Jun 2, 2009
Sold by
Wender Robert C
Bought by
Wells Fargo Bk 2003-Opt1
Purchase Details
Closed on
Apr 15, 2003
Sold by
Secretary Of Hud
Bought by
Wender Robert C
Home Financials for this Owner
Home Financials are based on the most recent Mortgage that was taken out on this home.
Original Mortgage
$80,800
Interest Rate
5.6%
Mortgage Type
New Conventional
Purchase Details
Closed on
Nov 5, 2002
Sold by
Chase Manhattan Mtg Corp
Bought by
Sec Of Hud
Purchase Details
Closed on
Nov 27, 2000
Sold by
Freeland Michael P and Freeland Jane A
Bought by
Cromer Jason D
Home Financials for this Owner
Home Financials are based on the most recent Mortgage that was taken out on this home.
Original Mortgage
$103,630
Interest Rate
7.75%
Mortgage Type
FHA
Create a Home Valuation Report for This Property
The Home Valuation Report is an in-depth analysis detailing your home's value as well as a comparison with similar homes in the area
Home Values in the Area
Average Home Value in this Area
Purchase History
| Date | Buyer | Sale Price | Title Company |
|---|---|---|---|
| Dga Rentals Llc | -- | -- | |
| Argo Grant | $37,500 | -- | |
| Wells Fargo Bk 2003-Opt1 | $79,779 | -- | |
| Wender Robert C | -- | -- | |
| Sec Of Hud | -- | -- | |
| Chase Manhattan Mtg Corp | $110,020 | -- | |
| Cromer Jason D | $104,500 | -- |
Source: Public Records
Mortgage History
| Date | Status | Borrower | Loan Amount |
|---|---|---|---|
| Previous Owner | Wender Robert C | $80,800 | |
| Previous Owner | Cromer Jason D | $103,630 |
Source: Public Records
Tax History Compared to Growth
Tax History
| Year | Tax Paid | Tax Assessment Tax Assessment Total Assessment is a certain percentage of the fair market value that is determined by local assessors to be the total taxable value of land and additions on the property. | Land | Improvement |
|---|---|---|---|---|
| 2024 | $1,842 | $58,560 | $14,000 | $44,560 |
| 2023 | $1,842 | $58,560 | $14,000 | $44,560 |
| 2022 | $1,907 | $58,560 | $14,000 | $44,560 |
| 2021 | $1,718 | $52,680 | $15,120 | $37,560 |
| 2020 | $1,142 | $34,440 | $6,760 | $27,680 |
| 2019 | $1,033 | $33,360 | $6,760 | $26,600 |
| 2018 | $1,014 | $32,600 | $6,760 | $25,840 |
| 2017 | $934 | $29,436 | $6,760 | $22,676 |
| 2016 | $915 | $28,360 | $6,760 | $21,600 |
| 2015 | $999 | $30,320 | $7,800 | $22,520 |
| 2014 | $941 | $28,000 | $7,800 | $20,200 |
| 2013 | -- | $28,000 | $7,800 | $20,200 |
Source: Public Records
Map
Nearby Homes
- 5287 Yeager Rd
- 5804 MacEdin Dr
- 3990 N Quail Dr
- 5744 Amalfi Way
- 4028 N Quail Dr
- 4025 N Quail Dr
- 5725 MacEdin Dr
- 4092 Yeager Rd
- 5680 Central Church Rd
- 3795 Willowbrook Dr
- 6122 Hillpine Dr
- 6119 Lullwater Dr
- 4100 Kings Hwy
- 5670 Bob White Ln
- 6201 Hillpine Dr
- 3684 Highway 5
- 6226 Lullwater Dr
- 5906 Pine Hurst Way
- 0 Central Church Rd Unit 10485955
- 5853 Oak Ct
- 5871 Oak Ct Unit 2
- 5844 W Amalfi Way Unit 3/98
- 5844 W Amalfi Way
- 5856 W Amalfi Way
- 5864 Oak Ct
- 5830 W Amalfi Way
- 5872 Oak Ct Unit 2
- 5841 Oak Ct
- 5841 Oak Ct Unit 2
- 5852 Oak Ct
- 5885 Oak Ct
- 0 Oak Ct Unit 8152208
- 0 Oak Ct Unit 7163787
- 0 Oak Ct Unit 3240532
- 5876 Oak Ct
- 5868 W Amalfi Way
- 5818 W Amalfi Way
- W W Amalfi Way Unit 26
- W W Amalfi Way Unit 3/98