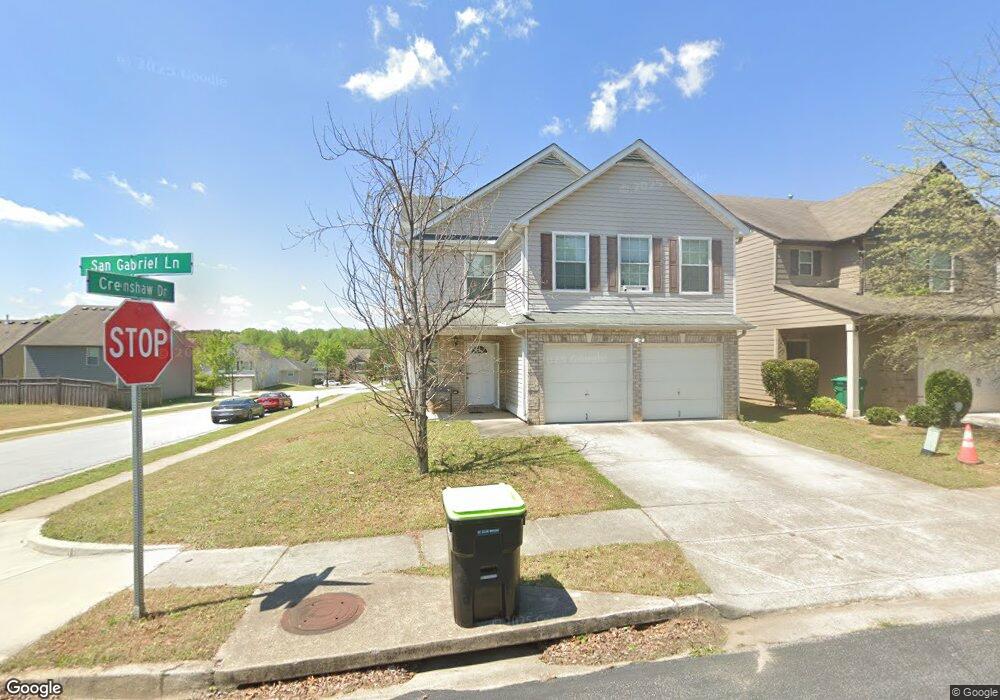
5869 San Gabriel Ln Atlanta, GA 30349
Estimated Value: $300,000 - $319,000
5
Beds
3
Baths
2,620
Sq Ft
$118/Sq Ft
Est. Value
About This Home
This home is located at 5869 San Gabriel Ln, Atlanta, GA 30349 and is currently estimated at $309,809, approximately $118 per square foot. 5869 San Gabriel Ln is a home located in Clayton County with nearby schools including Northcutt Elementary School, North Clayton Middle School, and North Clayton High School.
Ownership History
Date
Name
Owned For
Owner Type
Purchase Details
Closed on
Oct 20, 2017
Sold by
Fannin Antonio
Bought by
Cheikhiouna Lo
Current Estimated Value
Home Financials for this Owner
Home Financials are based on the most recent Mortgage that was taken out on this home.
Original Mortgage
$154,151
Outstanding Balance
$130,216
Interest Rate
4.25%
Mortgage Type
FHA
Estimated Equity
$179,593
Purchase Details
Closed on
Dec 12, 2011
Sold by
Federal National Mortgage Association
Bought by
Fannin Antonio
Purchase Details
Closed on
Jun 7, 2011
Sold by
Bac Home Loans Servicing Lp
Bought by
Federal Natl Mtg Assn Fnma
Purchase Details
Closed on
Feb 15, 2008
Sold by
Legacy Cmntys Of Crenshaw Park
Bought by
Daniels Marvin D
Home Financials for this Owner
Home Financials are based on the most recent Mortgage that was taken out on this home.
Original Mortgage
$157,191
Interest Rate
5.65%
Mortgage Type
Stand Alone Second
Create a Home Valuation Report for This Property
The Home Valuation Report is an in-depth analysis detailing your home's value as well as a comparison with similar homes in the area
Home Values in the Area
Average Home Value in this Area
Purchase History
| Date | Buyer | Sale Price | Title Company |
|---|---|---|---|
| Cheikhiouna Lo | $162,000 | -- | |
| Fannin Antonio | $68,000 | -- | |
| Federal Natl Mtg Assn Fnma | -- | -- | |
| Bac Home Loans Servicing Lp | $91,286 | -- | |
| Daniels Marvin D | $137,200 | -- |
Source: Public Records
Mortgage History
| Date | Status | Borrower | Loan Amount |
|---|---|---|---|
| Open | Cheikhiouna Lo | $154,151 | |
| Previous Owner | Daniels Marvin D | $157,191 |
Source: Public Records
Tax History Compared to Growth
Tax History
| Year | Tax Paid | Tax Assessment Tax Assessment Total Assessment is a certain percentage of the fair market value that is determined by local assessors to be the total taxable value of land and additions on the property. | Land | Improvement |
|---|---|---|---|---|
| 2024 | $4,585 | $126,560 | $9,600 | $116,960 |
| 2023 | $4,705 | $130,320 | $9,600 | $120,720 |
| 2022 | $3,839 | $106,840 | $9,600 | $97,240 |
| 2021 | $3,068 | $86,720 | $9,600 | $77,120 |
| 2020 | $2,754 | $77,900 | $9,600 | $68,300 |
| 2019 | $2,583 | $72,700 | $4,400 | $68,300 |
| 2018 | $2,263 | $64,800 | $5,600 | $59,200 |
| 2017 | $1,324 | $41,600 | $5,600 | $36,000 |
| 2016 | $1,324 | $41,600 | $5,600 | $36,000 |
| 2015 | $1,303 | $0 | $0 | $0 |
| 2014 | $1,072 | $35,982 | $4,400 | $31,582 |
Source: Public Records
Map
Nearby Homes
- 5854 El Segundo Way
- 1947 Eshelman Ct
- 5950 Milligan Ct
- 1969 Banks Way
- 1125 Knight Ct
- 5768 Grande River Rd
- 5937 Yellowood Ct
- 6073 Camden Forrest Dr
- 6105 Camden Forrest Ct
- 1618 Blossom Dr
- 6076 Camden Forrest Dr
- 1853 Broad River Rd
- 6080 Camden Forrest Cove
- 5728 Norman Ct
- 6105 E Fayetteville Dr
- 5668 Williamsburg Trace
- 5867 San Gabriel Ln Unit 154
- 5865 San Gabriel Ln
- 5865 San Gabriel Ln Unit 153
- 5866 El Segundo Way
- 5877 San Gabriel Ln Unit 156
- 5877 San Gabriel Ln
- 5864 El Segundo Way
- 5863 San Gabriel Ln Unit 152
- 5862 El Segundo Way
- 5879 San Gabriel Ln Unit 157
- 5879 San Gabriel Ln
- 5872 El Segundo Way Unit 135
- 5872 El Segundo Way
- 5872 San Gabriel Ln
- 5860 El Segundo Way
- 5870 San Gabriel Ln Unit 210
- 5870 San Gabriel Ln
- 5861 San Gabriel Ln
- 5868 San Gabriel Ln
- 5874 El Segundo Way Unit 134