587 6th St West Point, MS 39773
Estimated Value: $141,000 - $175,345
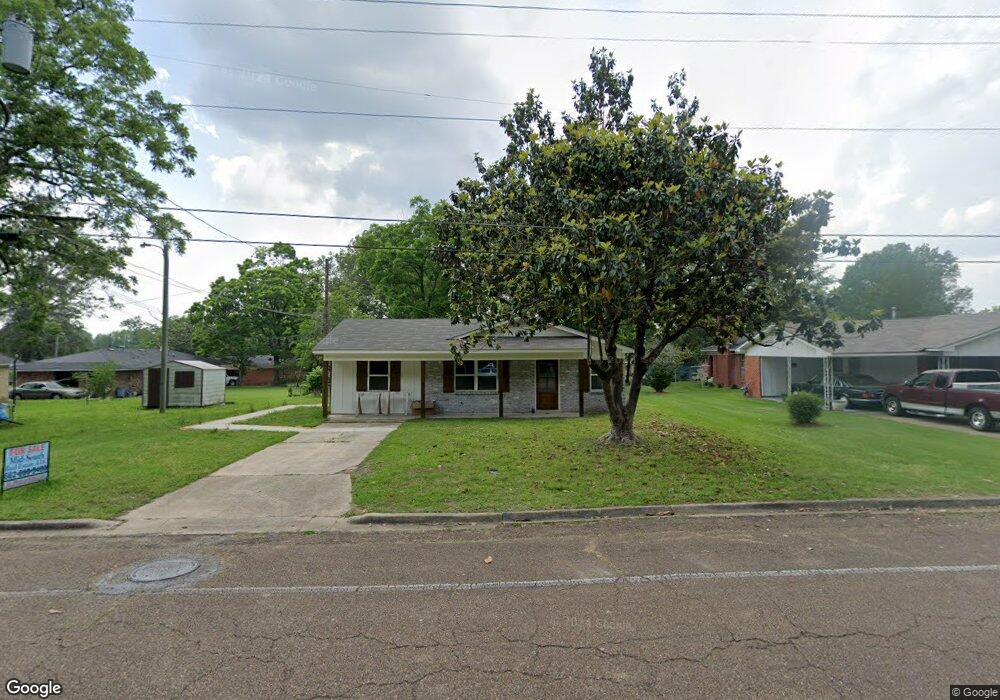
About This Home
This home is located at 587 6th St, West Point, MS 39773 and is currently estimated at $153,836, approximately $104 per square foot. 587 6th St is a home located in Clay County with nearby schools including East Side Elementary School, West Clay Elementary School, and Church Hill Elementary School.
Ownership History
We collect this data history from publicly available records. To have your information removed, we recommend requesting removal directly through your county’s website.
Purchase Details
Home Financials for this Owner
Home Financials are based on the most recent Mortgage that was taken out on this home.Purchase Details
Purchase History
We collect this data history from publicly available records. To have your information removed, we recommend requesting removal directly through your county’s website.
| Date | Buyer | Sale Price | Title Company |
|---|---|---|---|
| -- | None Listed On Document | ||
| -- | -- |
Mortgage History
We collect this data history from publicly available records. To have your information removed, we recommend requesting removal directly through your county’s website.
| Date | Status | Borrower | Loan Amount |
|---|---|---|---|
| Open | $172,633 | ||
| Closed | $0 |
Tax History
We collect this data history from publicly available records. To have your information removed, we recommend requesting removal directly through your county’s website.
| Year | Tax Paid | Tax Assessment Tax Assessment Total Assessment is a certain percentage of the fair market value that is determined by local assessors to be the total taxable value of land and additions on the property. | Land | Improvement |
|---|---|---|---|---|
| 2025 | $247 | $6,868 | $750 | $6,118 |
| 2024 | $559 | $10,302 | $1,125 | $9,177 |
| 2023 | $1,298 | $8,672 | $1,125 | $7,547 |
| 2022 | $484 | $8,672 | $1,125 | $7,547 |
| 2021 | $478 | $8,672 | $1,125 | $7,547 |
| 2020 | $480 | $8,672 | $1,125 | $7,547 |
| 2019 | $443 | $8,603 | $1,125 | $7,478 |
| 2018 | $169 | $5,735 | $750 | $4,985 |
| 2017 | $167 | $5,735 | $750 | $4,985 |
| 2016 | $164 | $5,735 | $750 | $4,985 |
| 2015 | -- | $5,146 | $750 | $4,396 |
| 2014 | $118 | $5,146 | $750 | $4,396 |
| 2013 | $118 | $5,146 | $750 | $4,396 |
Map
- 761 E Morrow St
- 61 Chandler St
- 27045 E Main St
- 237 Guyton Cir
- 26852 E Main St
- 26788 E Main St
- 27185 E Main St
- 72 Park St
- 963 E Broad St
- 440 Calhoun St
- 33 High St
- 600 E Westbrook St
- 13 Cul de Sac St
- 355 Mccord St
- 7642 Highway 45 Alternate N
- 341 Mccord St
- 184 Tournament St
- 33 Dix St
- 167 Court St
- 35 Rich St
Ask me questions while you tour the home.