
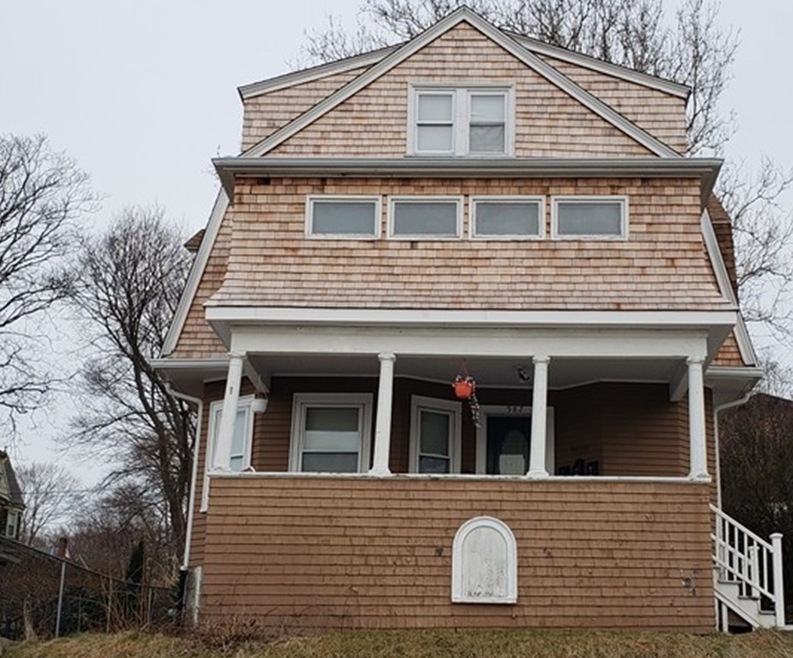
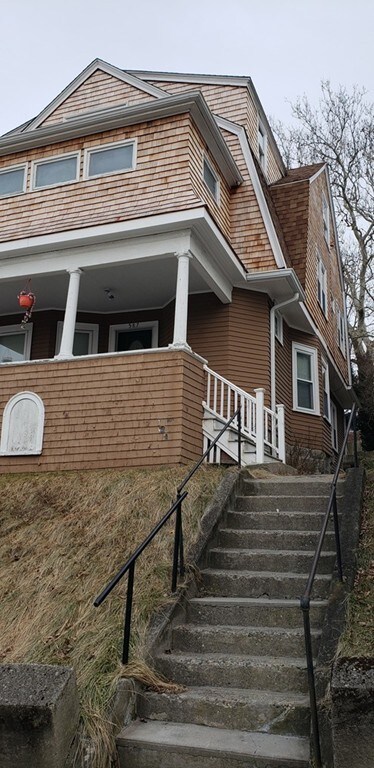
587 June St Fall River, MA 02720
Lower Highlands Neighborhood
6
Beds
3
Baths
3,222
Sq Ft
3,920
Sq Ft Lot
About This Home
As of May 2019Location, Location, Location, don't miss out on this great three family in the lower Highlands. This home is ideal for both owner occupied & investment.
Property Details
Home Type
- Multi-Family
Est. Annual Taxes
- $5,945
Year Built
- Built in 1900
Utilities
- Natural Gas Water Heater
Additional Features
- Basement
Listing and Financial Details
- Assessor Parcel Number M:0O-09 B:0000 L:0032
Ownership History
Date
Name
Owned For
Owner Type
Purchase Details
Closed on
Dec 1, 2017
Sold by
Mercurio Richard A and Mercurio Elizabeth W
Bought by
Mercurio T T and Mercurio M
Current Estimated Value
Purchase Details
Closed on
Nov 23, 2011
Sold by
Andrade Louis
Bought by
Spruce Rt and Andrade
Purchase Details
Closed on
Nov 18, 2011
Sold by
Department Of Housing & Urban Dev
Bought by
Andrade Louis
Purchase Details
Closed on
Dec 6, 2010
Sold by
Wells Fargo Bk
Bought by
Department Of Housing & Urban Dev
Purchase Details
Closed on
Oct 1, 2001
Sold by
Martin Imaculada M and Martin Bruno
Bought by
Saulnier Phil D and Saulnier Tracy L
Purchase Details
Closed on
Jan 7, 1988
Sold by
Martin Marilyn
Bought by
Martin Paulo A
Similar Homes in Fall River, MA
Create a Home Valuation Report for This Property
The Home Valuation Report is an in-depth analysis detailing your home's value as well as a comparison with similar homes in the area
Home Values in the Area
Average Home Value in this Area
Purchase History
| Date | Type | Sale Price | Title Company |
|---|---|---|---|
| Deed | -- | -- | |
| Deed | -- | -- | |
| Deed | $105,000 | -- | |
| Land Court Massachusetts | -- | -- | |
| Deed | $166,500 | -- | |
| Deed | $157,500 | -- |
Source: Public Records
Mortgage History
| Date | Status | Loan Amount | Loan Type |
|---|---|---|---|
| Open | $284,747 | FHA | |
| Previous Owner | $156,750 | New Conventional | |
| Previous Owner | $179,201 | FHA | |
| Previous Owner | $181,649 | New Conventional | |
| Previous Owner | $89,100 | No Value Available | |
| Previous Owner | $50,000 | No Value Available | |
| Previous Owner | $195,800 | No Value Available | |
| Previous Owner | $195,800 | No Value Available |
Source: Public Records
Property History
| Date | Event | Price | Change | Sq Ft Price |
|---|---|---|---|---|
| 05/31/2019 05/31/19 | Sold | $290,000 | -1.5% | $90 / Sq Ft |
| 05/02/2019 05/02/19 | Pending | -- | -- | -- |
| 04/17/2019 04/17/19 | For Sale | $294,299 | 0.0% | $91 / Sq Ft |
| 04/08/2019 04/08/19 | Pending | -- | -- | -- |
| 03/28/2019 03/28/19 | Price Changed | $294,299 | -0.1% | $91 / Sq Ft |
| 03/12/2019 03/12/19 | Price Changed | $294,499 | -0.2% | $91 / Sq Ft |
| 02/27/2019 02/27/19 | Price Changed | $294,999 | -1.5% | $92 / Sq Ft |
| 02/22/2019 02/22/19 | Price Changed | $299,499 | -0.2% | $93 / Sq Ft |
| 02/07/2019 02/07/19 | For Sale | $299,999 | +43.5% | $93 / Sq Ft |
| 07/05/2017 07/05/17 | Sold | $209,000 | -4.8% | $65 / Sq Ft |
| 05/30/2017 05/30/17 | Pending | -- | -- | -- |
| 04/11/2017 04/11/17 | Price Changed | $219,500 | -2.7% | $68 / Sq Ft |
| 03/12/2017 03/12/17 | For Sale | $225,500 | 0.0% | $70 / Sq Ft |
| 03/05/2017 03/05/17 | Pending | -- | -- | -- |
| 02/22/2017 02/22/17 | For Sale | $225,500 | 0.0% | $70 / Sq Ft |
| 02/02/2017 02/02/17 | Pending | -- | -- | -- |
| 01/25/2017 01/25/17 | Price Changed | $225,500 | -0.9% | $70 / Sq Ft |
| 01/03/2017 01/03/17 | For Sale | $227,500 | +8.9% | $71 / Sq Ft |
| 01/01/2017 01/01/17 | Off Market | $209,000 | -- | -- |
| 10/03/2016 10/03/16 | Price Changed | $227,500 | -8.8% | $71 / Sq Ft |
| 08/31/2016 08/31/16 | For Sale | $249,500 | +34.9% | $77 / Sq Ft |
| 10/24/2013 10/24/13 | Sold | $185,000 | -2.6% | $57 / Sq Ft |
| 09/24/2013 09/24/13 | Pending | -- | -- | -- |
| 07/17/2013 07/17/13 | For Sale | $189,900 | -- | $59 / Sq Ft |
Source: MLS Property Information Network (MLS PIN)
Tax History Compared to Growth
Tax History
| Year | Tax Paid | Tax Assessment Tax Assessment Total Assessment is a certain percentage of the fair market value that is determined by local assessors to be the total taxable value of land and additions on the property. | Land | Improvement |
|---|---|---|---|---|
| 2025 | $5,945 | $519,200 | $90,400 | $428,800 |
| 2024 | $5,697 | $495,800 | $87,000 | $408,800 |
| 2023 | $5,010 | $408,300 | $75,200 | $333,100 |
| 2022 | $4,447 | $352,400 | $70,300 | $282,100 |
| 2021 | $4,265 | $308,400 | $70,500 | $237,900 |
| 2020 | $4,813 | $333,100 | $70,700 | $262,400 |
| 2019 | $3,097 | $212,400 | $71,800 | $140,600 |
| 2018 | $2,892 | $197,800 | $71,800 | $126,000 |
| 2017 | $2,687 | $191,900 | $65,900 | $126,000 |
| 2016 | $2,575 | $188,900 | $65,900 | $123,000 |
| 2015 | $2,536 | $193,900 | $65,900 | $128,000 |
| 2014 | $2,927 | $232,700 | $93,100 | $139,600 |
Source: Public Records
Agents Affiliated with this Home
-
Seller's Agent in 2019
Kevin Teves
SBA Realty Group
(508) 596-3615
69 Total Sales
-
B
Buyer's Agent in 2019
Benjamin Israel
Keller Williams Pinnacle Central
2 Total Sales
-
P
Seller's Agent in 2017
Peter Avila
Berkshire Hathaway Home Services - Mel Antonio Real Estate
-
Seller's Agent in 2013
Clifford Ponte
Keller Williams South Watuppa
(508) 642-4802
1 in this area
481 Total Sales
-
T
Buyer's Agent in 2013
Tracy Pavao
Keller Williams South Watuppa
Map
Source: MLS Property Information Network (MLS PIN)
MLS Number: 72450890
APN: FALL-000009O-000000-000032
Disclaimer: Certain information contained herein is derived from information provided by parties other than Homes.com. All information provided is deemed reliable, but is not guaranteed to be accurate and should be independently verified.
![]() The property listing data and information, or the Images, set forth herein were provided to MLS Property Information Network, Inc. from third party sources, including sellers, lessors and public records, and were compiled by MLS Property Information Network, Inc. The property listing data and information, and the Images, are for the personal, non-commercial use of consumers having a good faith interest in purchasing or leasing listed properties of the type displayed to them and may not be used for any purpose other than to identify prospective properties which such consumers may have a good faith interest in purchasing or leasing. MLS Property Information Network, Inc. and its subscribers disclaim any and all representations and warranties as to the accuracy of the property listing data and information, or as to the accuracy of any of the Images, set forth herein.
The property listing data and information, or the Images, set forth herein were provided to MLS Property Information Network, Inc. from third party sources, including sellers, lessors and public records, and were compiled by MLS Property Information Network, Inc. The property listing data and information, and the Images, are for the personal, non-commercial use of consumers having a good faith interest in purchasing or leasing listed properties of the type displayed to them and may not be used for any purpose other than to identify prospective properties which such consumers may have a good faith interest in purchasing or leasing. MLS Property Information Network, Inc. and its subscribers disclaim any and all representations and warranties as to the accuracy of the property listing data and information, or as to the accuracy of any of the Images, set forth herein.
Nearby Homes
- 909 High St
- 72 Belmont St
- 114 Prospect St
- 327 Brownell St
- 750 Davol St Unit 1012
- 750 Davol St Unit 324
- 750 Davol St Unit 415
- 56 Gatehouse Dr
- 35 Hood St
- 1240-1246 N Main St
- 654 Highland Ave
- 503 Highland Ave
- 95 Ballard St
- 450 Rock St Unit 2
- 339 Danforth St Unit 6
- 337 Danforth St Unit 7
- 302 Cory St
- 376 N Underwood St
- 806 President Ave
- 364 High St