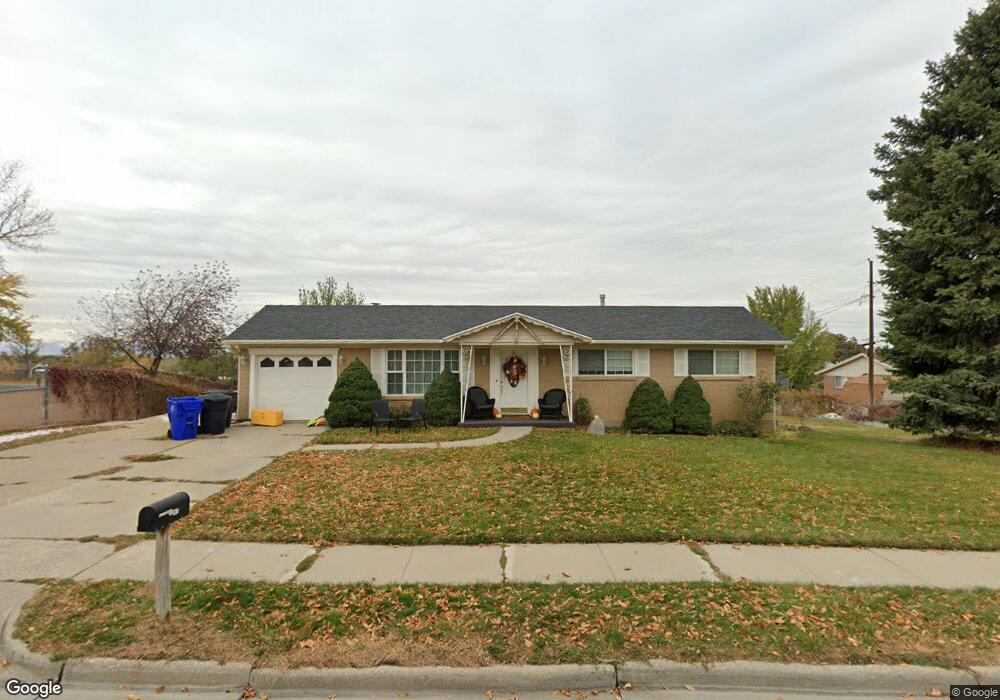
587 N 700 E Bountiful, UT 84010
Estimated Value: $452,622 - $585,000
3
Beds
1
Bath
1,125
Sq Ft
$441/Sq Ft
Est. Value
About This Home
This home is located at 587 N 700 E, Bountiful, UT 84010 and is currently estimated at $495,656, approximately $440 per square foot. 587 N 700 E is a home located in Davis County with nearby schools including Tolman School, Bountiful Junior High School, and Bountiful High School.
Ownership History
Date
Name
Owned For
Owner Type
Purchase Details
Closed on
Aug 4, 2023
Sold by
Jackson-Showell Sheila
Bought by
Sheila Jackson-Showell Trust and Jackson-Showell
Current Estimated Value
Purchase Details
Closed on
Aug 4, 2022
Sold by
Jackson Sheila and Showell Raymond
Bought by
Jackson-Showell Sheila
Purchase Details
Closed on
Mar 17, 2021
Sold by
Jackson Showell Sheila
Bought by
Jackson Sheila and Showell Raymond
Home Financials for this Owner
Home Financials are based on the most recent Mortgage that was taken out on this home.
Original Mortgage
$295,500
Interest Rate
2.7%
Mortgage Type
New Conventional
Purchase Details
Closed on
Apr 4, 2011
Sold by
Jackson Showell Sheila
Bought by
Jackson Showell Sheila
Home Financials for this Owner
Home Financials are based on the most recent Mortgage that was taken out on this home.
Original Mortgage
$200,250
Interest Rate
4.84%
Mortgage Type
New Conventional
Purchase Details
Closed on
Nov 27, 2007
Sold by
Jackson Showell Sheila
Bought by
Jackson Showell Sheila
Home Financials for this Owner
Home Financials are based on the most recent Mortgage that was taken out on this home.
Original Mortgage
$202,500
Interest Rate
6.36%
Mortgage Type
New Conventional
Purchase Details
Closed on
Dec 17, 2003
Sold by
Jackson Sheila
Bought by
Showell Sheila Jackson
Home Financials for this Owner
Home Financials are based on the most recent Mortgage that was taken out on this home.
Original Mortgage
$129,600
Interest Rate
5.97%
Mortgage Type
New Conventional
Purchase Details
Closed on
Dec 16, 2003
Sold by
Showell Sheila Jackson
Bought by
Jackson Sheila
Home Financials for this Owner
Home Financials are based on the most recent Mortgage that was taken out on this home.
Original Mortgage
$129,600
Interest Rate
5.97%
Mortgage Type
New Conventional
Purchase Details
Closed on
Nov 7, 2002
Sold by
Jackson Sheila
Bought by
Showell Sheila Jackson
Purchase Details
Closed on
Oct 3, 2002
Sold by
Jackson David A and Jackson Evelyn G
Bought by
Jackson Sheila
Purchase Details
Closed on
Oct 11, 1999
Sold by
Jackson David A and Jackson Evelyn G
Bought by
Jackson David A and Jackson Evelyn G
Purchase Details
Closed on
May 22, 1998
Sold by
Jackson David A and Jackson Evelyn G
Bought by
Jackson David A and Jackson Evelyn G
Home Financials for this Owner
Home Financials are based on the most recent Mortgage that was taken out on this home.
Original Mortgage
$75,000
Interest Rate
7.13%
Create a Home Valuation Report for This Property
The Home Valuation Report is an in-depth analysis detailing your home's value as well as a comparison with similar homes in the area
Purchase History
| Date | Buyer | Sale Price | Title Company |
|---|---|---|---|
| Sheila Jackson-Showell Trust | -- | None Listed On Document | |
| Jackson-Showell Sheila | -- | None Listed On Document | |
| Jackson-Showell Sheila | -- | None Listed On Document | |
| Jackson Sheila | -- | Meridian Title Comp | |
| Jackson Showell Sheila | -- | None Available | |
| Jackson Showell Sheila | -- | Equity Title Ins Agency Inc | |
| Jackson Showell Sheila | -- | Equity Title Ins Agency Inc | |
| Showell Sheila Jackson | -- | Equity Title Agency | |
| Jackson Sheila | -- | Equity Title Agency | |
| Showell Sheila Jackson | -- | -- | |
| Jackson Sheila | -- | -- | |
| Jackson David A | -- | -- | |
| Jackson David A | -- | Preferred Title & Escrow |
Source: Public Records
Mortgage History
| Date | Status | Borrower | Loan Amount |
|---|---|---|---|
| Previous Owner | Jackson Sheila | $295,500 | |
| Previous Owner | Jackson Showell Sheila | $200,250 | |
| Previous Owner | Jackson Showell Sheila | $202,500 | |
| Previous Owner | Jackson Sheila | $129,600 | |
| Previous Owner | Jackson David A | $75,000 |
Source: Public Records
Tax History Compared to Growth
Tax History
| Year | Tax Paid | Tax Assessment Tax Assessment Total Assessment is a certain percentage of the fair market value that is determined by local assessors to be the total taxable value of land and additions on the property. | Land | Improvement |
|---|---|---|---|---|
| 2025 | $2,699 | $239,250 | $139,358 | $99,892 |
| 2024 | $2,527 | $233,200 | $128,402 | $104,798 |
| 2023 | $2,417 | $405,000 | $233,946 | $171,054 |
| 2022 | $2,558 | $235,950 | $124,732 | $111,218 |
| 2021 | $2,205 | $310,000 | $185,483 | $124,517 |
| 2020 | $1,950 | $274,000 | $168,868 | $105,132 |
| 2019 | $2,085 | $275,000 | $163,841 | $111,159 |
| 2018 | $1,921 | $252,000 | $152,537 | $99,463 |
| 2016 | $1,680 | $118,855 | $49,725 | $69,130 |
| 2015 | $1,659 | $110,770 | $49,725 | $61,045 |
| 2014 | $1,594 | $105,040 | $49,725 | $55,315 |
| 2013 | -- | $98,182 | $43,945 | $54,237 |
Source: Public Records
Map
Nearby Homes