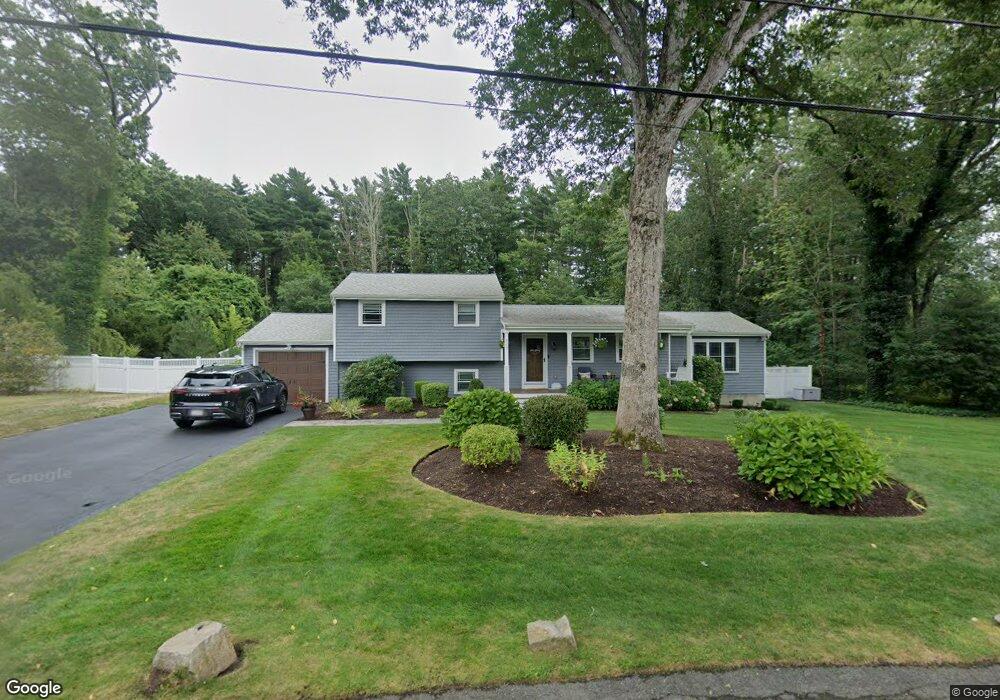
587 Old Town Way Hanover, MA 02339
Estimated Value: $707,759 - $1,071,000
3
Beds
2
Baths
1,100
Sq Ft
$772/Sq Ft
Est. Value
About This Home
This home is located at 587 Old Town Way, Hanover, MA 02339 and is currently estimated at $848,690, approximately $771 per square foot. 587 Old Town Way is a home located in Plymouth County with nearby schools including Hanover High School, Norwell KinderCare, and Cadence Academy Preschool - Hanover.
Ownership History
Date
Name
Owned For
Owner Type
Purchase Details
Closed on
May 14, 2024
Sold by
Dyer Kevin R and Dyer Joanna K
Bought by
Dyer T T and Dyer D
Current Estimated Value
Purchase Details
Closed on
Sep 8, 2006
Sold by
Lipsky Jonathan N and Chessler Jacqueline A
Bought by
Dyer Kevin R and Dyer Joanna K
Purchase Details
Closed on
Jun 17, 1992
Sold by
Mahony John and Mahony Deborah L
Bought by
Lipsky Jonathan N and Chessler Jacqueline
Create a Home Valuation Report for This Property
The Home Valuation Report is an in-depth analysis detailing your home's value as well as a comparison with similar homes in the area
Home Values in the Area
Average Home Value in this Area
Purchase History
| Date | Buyer | Sale Price | Title Company |
|---|---|---|---|
| Dyer T T | -- | None Available | |
| Dyer T T | -- | None Available | |
| Dyer Kevin R | $414,000 | -- | |
| Lipsky Jonathan N | $165,000 | -- | |
| Dyer Kevin R | $414,000 | -- | |
| Lipsky Jonathan N | $165,000 | -- |
Source: Public Records
Mortgage History
| Date | Status | Borrower | Loan Amount |
|---|---|---|---|
| Previous Owner | Lipsky Jonathan N | $341,500 | |
| Previous Owner | Lipsky Jonathan N | $348,000 |
Source: Public Records
Tax History Compared to Growth
Tax History
| Year | Tax Paid | Tax Assessment Tax Assessment Total Assessment is a certain percentage of the fair market value that is determined by local assessors to be the total taxable value of land and additions on the property. | Land | Improvement |
|---|---|---|---|---|
| 2025 | $7,908 | $640,300 | $269,400 | $370,900 |
| 2024 | $8,221 | $640,300 | $269,400 | $370,900 |
| 2023 | $8,461 | $627,200 | $244,900 | $382,300 |
| 2022 | $8,209 | $538,300 | $244,900 | $293,400 |
| 2021 | $8,621 | $527,900 | $222,600 | $305,300 |
| 2020 | $8,222 | $504,100 | $222,600 | $281,500 |
| 2019 | $7,805 | $475,600 | $222,600 | $253,000 |
| 2018 | $7,272 | $446,700 | $222,600 | $224,100 |
| 2017 | $6,410 | $388,000 | $209,500 | $178,500 |
| 2016 | $6,063 | $359,600 | $190,500 | $169,100 |
| 2015 | $5,808 | $359,600 | $190,500 | $169,100 |
Source: Public Records
Map
Nearby Homes
- 53 Chestnut St
- 70 Dillingham Way
- 375 Webster St
- 535 Webster St
- 7 Assinippi Ave Unit 205
- 7 Assinippi Ave Unit 306
- 62 Larchmont Ln
- 1239 Main St
- 73 Shingle Mill Ln
- 225 Prospect St
- 118 Hanover St
- 214 Washington St Unit 24
- 214 Washington St Unit 28
- 451 Main St
- Lot 24 Webster Farm Way
- Lot 1 Webster Farm Way
- Lot 4 Webster Farm Way
- Lot 22 Webster Farm Way
- Lot 26 Webster Farm Way
- 36 Grove St