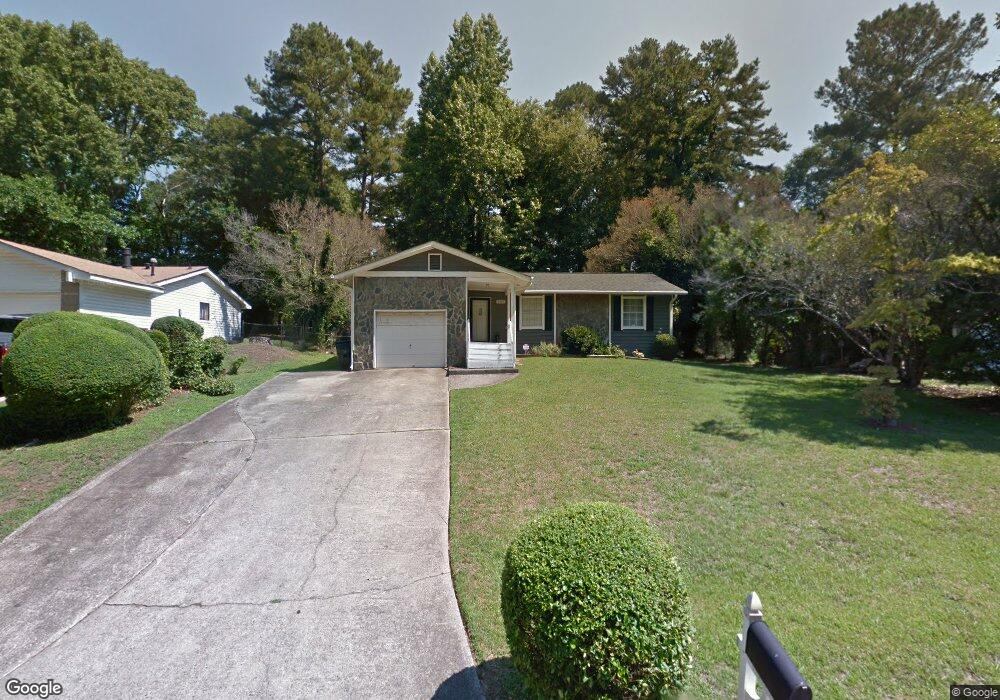
587 Post Oak Rd Jonesboro, GA 30238
Estimated Value: $193,449 - $211,000
3
Beds
2
Baths
1,090
Sq Ft
$188/Sq Ft
Est. Value
About This Home
This home is located at 587 Post Oak Rd, Jonesboro, GA 30238 and is currently estimated at $205,112, approximately $188 per square foot. 587 Post Oak Rd is a home located in Clayton County with nearby schools including Kemp Primary School, Kemp Elementary School, and Pointe South Middle School.
Ownership History
Date
Name
Owned For
Owner Type
Purchase Details
Closed on
Mar 13, 2000
Sold by
Elghonemy Khaled *
Bought by
Dorsey Evonnie D
Current Estimated Value
Home Financials for this Owner
Home Financials are based on the most recent Mortgage that was taken out on this home.
Original Mortgage
$87,923
Outstanding Balance
$29,798
Interest Rate
8.29%
Mortgage Type
FHA
Estimated Equity
$175,314
Purchase Details
Closed on
Aug 13, 1999
Sold by
Eghonemy Khaled I
Bought by
Eghonemy Khaled I
Home Financials for this Owner
Home Financials are based on the most recent Mortgage that was taken out on this home.
Original Mortgage
$61,650
Interest Rate
7.73%
Mortgage Type
New Conventional
Purchase Details
Closed on
Jun 1, 1999
Sold by
Hubbard Robert L and Hubbard Janie
Bought by
Ocwen Federal Bank Fsb
Create a Home Valuation Report for This Property
The Home Valuation Report is an in-depth analysis detailing your home's value as well as a comparison with similar homes in the area
Home Values in the Area
Average Home Value in this Area
Purchase History
| Date | Buyer | Sale Price | Title Company |
|---|---|---|---|
| Dorsey Evonnie D | $88,400 | -- | |
| Eghonemy Khaled I | -- | -- | |
| Elghonemy Khaled I | $64,900 | -- | |
| Ocwen Federal Bank Fsb | $55,439 | -- |
Source: Public Records
Mortgage History
| Date | Status | Borrower | Loan Amount |
|---|---|---|---|
| Open | Dorsey Evonnie D | $87,923 | |
| Previous Owner | Elghonemy Khaled I | $61,650 |
Source: Public Records
Tax History Compared to Growth
Tax History
| Year | Tax Paid | Tax Assessment Tax Assessment Total Assessment is a certain percentage of the fair market value that is determined by local assessors to be the total taxable value of land and additions on the property. | Land | Improvement |
|---|---|---|---|---|
| 2024 | $2,277 | $68,360 | $7,200 | $61,160 |
| 2023 | $2,337 | $64,720 | $7,200 | $57,520 |
| 2022 | $1,673 | $52,640 | $7,200 | $45,440 |
| 2021 | $1,168 | $39,560 | $7,200 | $32,360 |
| 2020 | $967 | $34,176 | $7,200 | $26,976 |
| 2019 | $816 | $30,100 | $5,600 | $24,500 |
| 2018 | $727 | $27,910 | $5,600 | $22,310 |
| 2017 | $424 | $20,414 | $5,600 | $14,814 |
| 2016 | $362 | $18,886 | $5,600 | $13,286 |
| 2015 | $363 | $0 | $0 | $0 |
| 2014 | $431 | $20,828 | $5,600 | $15,228 |
Source: Public Records
Map
Nearby Homes
- 420 Cheri Place
- 8988 Raven Dr
- 634 Post Oak Rd
- 8949 Raven Dr Unit I
- 9043 Raven Dr
- 9138 Sunset Dr Unit 3
- 616 Country Lane Dr
- 8865 Raven Dr
- 9103 Raven Dr
- 8896 Wellston Ct
- 9181 Welch Ct
- 8862 Wesley Place
- 529 Westminster Ln
- 8846 Wesley Place
- 444 Wellington Way
- 337 Independence Dr
- 345 Staten St
- 8962 Bentwood Ln
- 578 Wellington Way
- 553 Wellington Way
- 595 Post Oak Rd
- 579 Post Oak Rd
- 0 Post Oak Rd Unit 8873318
- 0 Post Oak Rd Unit 7369331
- 592 Raintree Dr Unit 1
- 584 Raintree Dr
- 571 Post Oak Rd
- 576 Raintree Dr Unit 1
- 609 Post Oak Rd
- 9263 Raven Dr
- 588 Post Oak Rd
- 600 Raintree Dr
- 580 Post Oak Rd
- 596 Post Oak Rd
- 568 Raintree Dr Unit 1
- 563 Post Oak Rd
- 9247 Raven Dr
- 572 Post Oak Rd
- 564 Post Oak Rd
- 560 Raintree Dr