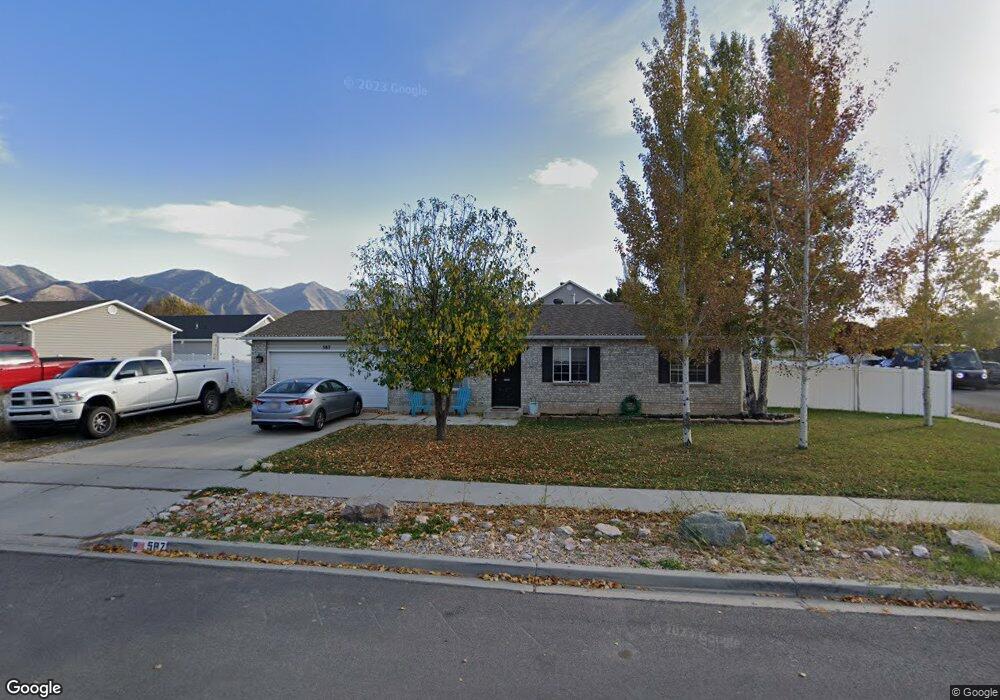
587 W 290 S Spanish Fork, UT 84660
Estimated Value: $428,000 - $463,000
3
Beds
2
Baths
1,014
Sq Ft
$435/Sq Ft
Est. Value
About This Home
This home is located at 587 W 290 S, Spanish Fork, UT 84660 and is currently estimated at $440,718, approximately $434 per square foot. 587 W 290 S is a home located in Utah County with nearby schools including Riverview Elementary School, Spanish Fork Jr High School, and Spanish Fork High School.
Ownership History
Date
Name
Owned For
Owner Type
Purchase Details
Closed on
Jul 3, 2019
Sold by
Detrick Christopher R
Bought by
Ostler Austin
Current Estimated Value
Purchase Details
Closed on
Nov 2, 2018
Sold by
Detrick Emily D
Bought by
Detrick Christopher R
Purchase Details
Closed on
Apr 29, 2009
Sold by
Vincent Jeffrey
Bought by
Detrick Christopher R and Detrick Emily D
Home Financials for this Owner
Home Financials are based on the most recent Mortgage that was taken out on this home.
Original Mortgage
$152,192
Interest Rate
4.71%
Mortgage Type
FHA
Purchase Details
Closed on
Jul 12, 2000
Sold by
Salisbury Development Lc
Bought by
Dalton Derek L and Dalton Melanie K
Home Financials for this Owner
Home Financials are based on the most recent Mortgage that was taken out on this home.
Original Mortgage
$116,224
Interest Rate
8.55%
Create a Home Valuation Report for This Property
The Home Valuation Report is an in-depth analysis detailing your home's value as well as a comparison with similar homes in the area
Home Values in the Area
Average Home Value in this Area
Purchase History
| Date | Buyer | Sale Price | Title Company |
|---|---|---|---|
| Ostler Austin | -- | Novation Title Ins Agcy | |
| Detrick Christopher R | -- | Accommodation | |
| Detrick Christopher R | -- | Pinnacle Title | |
| Dalton Derek L | -- | Provo Land Title Company |
Source: Public Records
Mortgage History
| Date | Status | Borrower | Loan Amount |
|---|---|---|---|
| Previous Owner | Detrick Christopher R | $152,192 | |
| Previous Owner | Dalton Derek L | $116,224 |
Source: Public Records
Tax History Compared to Growth
Tax History
| Year | Tax Paid | Tax Assessment Tax Assessment Total Assessment is a certain percentage of the fair market value that is determined by local assessors to be the total taxable value of land and additions on the property. | Land | Improvement |
|---|---|---|---|---|
| 2025 | $1,950 | $219,340 | $173,400 | $225,400 |
| 2024 | $1,950 | $201,025 | $0 | $0 |
| 2023 | $1,958 | $202,015 | $0 | $0 |
| 2022 | $2,110 | $213,510 | $0 | $0 |
| 2021 | $1,751 | $283,500 | $103,500 | $180,000 |
| 2020 | $1,666 | $262,300 | $94,100 | $168,200 |
| 2019 | $1,403 | $232,300 | $85,800 | $146,500 |
| 2018 | $1,289 | $206,400 | $79,000 | $127,400 |
| 2017 | $1,147 | $98,725 | $0 | $0 |
| 2016 | $1,060 | $89,980 | $0 | $0 |
| 2015 | $1,016 | $85,250 | $0 | $0 |
| 2014 | $910 | $76,615 | $0 | $0 |
Source: Public Records
Map
Nearby Homes
- 2645 W 360 S Unit 1
- 2576 W 360 S Unit 5
- 88 S 400 W
- 231 S 880 W
- 351 W 530 S
- 501 S 880 W
- 225 W 300 S
- 903 W 100 S
- 13 N 710 W
- 1026 W 350 S
- 324 S St Unit 204
- 1040 W Center St
- 325 S St Unit 203
- 298 S St Unit 205
- 42 W 200 S
- 1788 N 630 St W Unit 47
- 1826 N 630 St W Unit 101
- 956 W 40 N
- 134 N 300 W
- 134 W 700 S