Estimated payment $1,049/month
Highlights
- 1-Story Property
- Forced Air Heating System
- Washer and Dryer
- Kanab Middle School Rated A-
- Evaporated cooling system
About This Home
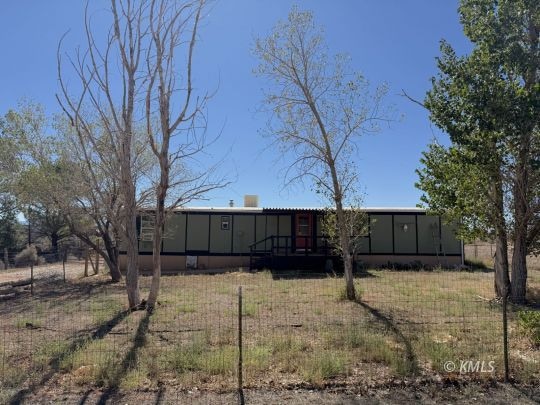
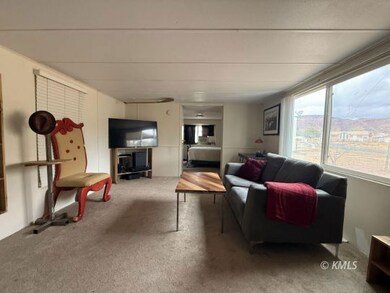
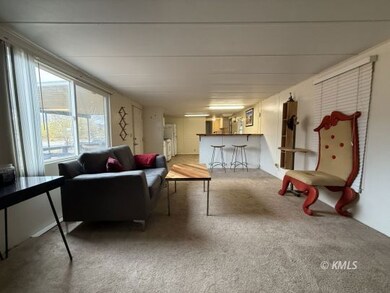
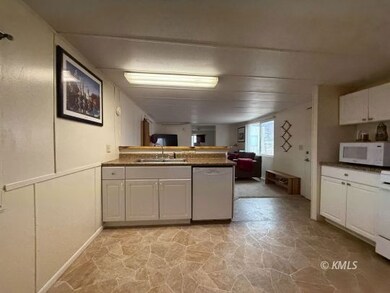
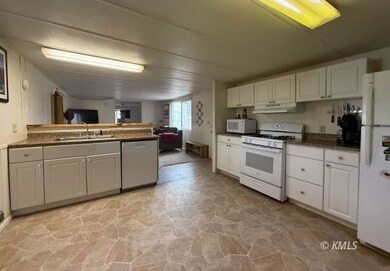
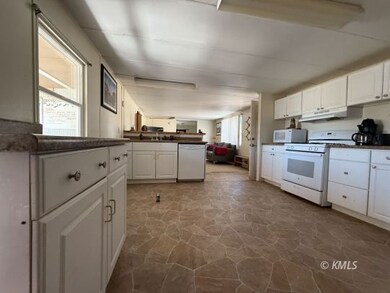
Looking for a great deal? An affordable place to hang your hat? A home to live in while building your dream home? Don't miss this 840sf 2 bed 1.5 bath 1986 manufactured home on .31 acres in the Ranchos. Great views and lots of potential!
Listing Agent
Roxanne Leonard
Berkshire Hathaway Home Services Utah Properties (Kanab) Brokerage Phone: (435) 229-6911 License #7899746-BB00 Listed on: 11/27/2025
Property Details
Home Type
- Mobile/Manufactured
Est. Annual Taxes
- $644
Year Built
- Built in 1986
Lot Details
- 0.31 Acre Lot
Interior Spaces
- 840 Sq Ft Home
- 1-Story Property
- Crawl Space
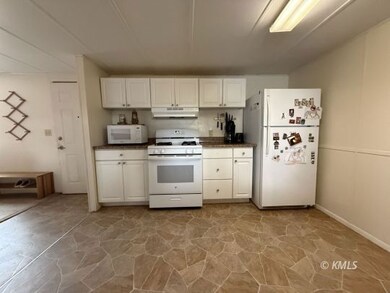
- Oven or Range
- Washer and Dryer
Bedrooms and Bathrooms
- 2 Bedrooms
Schools
- Kanab Elementary And Middle School
- Kanab High School
Utilities
- Evaporated cooling system
- Forced Air Heating System
- Propane
- Water Heater
- Septic System
- Fiber Optics Available
Community Details
- Kanab Creek Ranchos Subdivision
Listing and Financial Details
- Assessor Parcel Number 72-1383
Map
Home Values in the Area
Average Home Value in this Area
Tax History
| Year | Tax Paid | Tax Assessment Tax Assessment Total Assessment is a certain percentage of the fair market value that is determined by local assessors to be the total taxable value of land and additions on the property. | Land | Improvement |
|---|---|---|---|---|
| 2025 | $669 | $75,084 | $51,550 | $23,534 |
| 2024 | $669 | $77,754 | $51,467 | $26,287 |
| 2023 | $584 | $69,561 | $47,655 | $21,906 |
| 2022 | $433 | $51,028 | $30,745 | $20,283 |
| 2021 | $415 | $73,476 | $43,000 | $30,476 |
| 2020 | $420 | $72,159 | $50,562 | $21,597 |
| 2019 | $375 | $62,808 | $43,967 | $18,841 |
| 2018 | $335 | $55,480 | $36,639 | $18,841 |
| 2017 | $620 | $54,810 | $31,860 | $22,950 |
| 2016 | $576 | $49,500 | $26,550 | $22,950 |
| 2015 | $619 | $43,176 | $26,082 | $17,094 |
| 2014 | $619 | $52,060 | $37,260 | $14,800 |
| 2013 | -- | $52,060 | $0 | $0 |
Property History
| Date | Event | Price | List to Sale | Price per Sq Ft |
|---|---|---|---|---|
| 11/27/2025 11/27/25 | For Sale | $189,000 | -- | $225 / Sq Ft |
Purchase History
| Date | Type | Sale Price | Title Company |
|---|---|---|---|
| Warranty Deed | -- | -- | |
| Grant Deed | -- | -- | |
| Warranty Deed | -- | -- | |
| Deed | -- | -- | |
| Warranty Deed | -- | -- | |
| Quit Claim Deed | -- | -- | |
| Warranty Deed | -- | -- |
Source: Kanab UT MLS
MLS Number: 1409165
APN: 0101934
- 1686 S Powell Dr
- 725 W Aspen Dr
- 422 Piute Dr
- 742 W Vance Dr
- 1675 W Creekside Dr
- 1603 S Escalante Dr
- 1681 E Creekside Dr Unit 41
- 0 1681 So East Creekside
- 859 W Chamberlain Dr
- 1768 S Lee Dr
- 941 W Chamberlain Dr
- 1828 S Lee Dr
- 1459 S Stewart Dr
- 1354 S Vermillion Dr
- 1556 S Lee Dr
- 1389 S Heaton Dr
- 1540 S Lee Dr
- 1369 S Stewart Dr W Unit 250
- 0 Kane Plex Unit 1409147
- 425 S Moki Dr Unit I-1