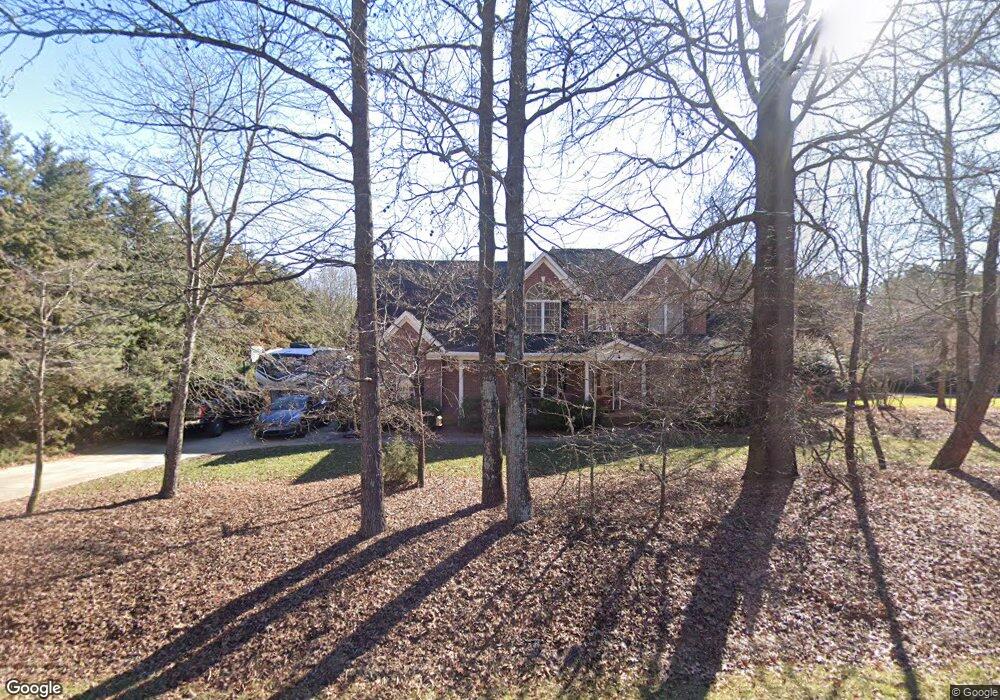
5870 Johnson Rd Clover, SC 29710
Estimated Value: $704,620 - $874,000
4
Beds
4
Baths
3,230
Sq Ft
$245/Sq Ft
Est. Value
About This Home
This home is located at 5870 Johnson Rd, Clover, SC 29710 and is currently estimated at $789,905, approximately $244 per square foot. 5870 Johnson Rd is a home located in York County with nearby schools including Crowders Creek Elementary School, Oakridge Middle School, and Clover High School.
Ownership History
Date
Name
Owned For
Owner Type
Purchase Details
Closed on
Jun 23, 2013
Sold by
Margraf Douglas O and Margraf Diane L
Bought by
Burns Jason M and Burns Elizabeth A
Current Estimated Value
Home Financials for this Owner
Home Financials are based on the most recent Mortgage that was taken out on this home.
Original Mortgage
$339,300
Interest Rate
4.31%
Mortgage Type
New Conventional
Purchase Details
Closed on
Jul 27, 2006
Sold by
Vaughn Rose Joseph Wayne and Vaughn Rose Judy La
Bought by
Margraf Douglas O and Margraf Diane L
Purchase Details
Closed on
Oct 4, 2005
Sold by
Dcm Construction Llc
Bought by
Rose Joseph Wayne and Rose La Vaughn
Home Financials for this Owner
Home Financials are based on the most recent Mortgage that was taken out on this home.
Original Mortgage
$362,950
Interest Rate
5.66%
Mortgage Type
New Conventional
Purchase Details
Closed on
Apr 30, 2004
Sold by
Lwmo Llc
Bought by
Dcm Construction Llc
Create a Home Valuation Report for This Property
The Home Valuation Report is an in-depth analysis detailing your home's value as well as a comparison with similar homes in the area
Home Values in the Area
Average Home Value in this Area
Purchase History
| Date | Buyer | Sale Price | Title Company |
|---|---|---|---|
| Burns Jason M | $377,000 | -- | |
| Margraf Douglas O | $417,900 | None Available | |
| Rose Joseph Wayne | $370,150 | -- | |
| Dcm Construction Llc | $35,000 | -- |
Source: Public Records
Mortgage History
| Date | Status | Borrower | Loan Amount |
|---|---|---|---|
| Previous Owner | Burns Jason M | $339,300 | |
| Previous Owner | Rose Joseph Wayne | $362,950 |
Source: Public Records
Tax History
| Year | Tax Paid | Tax Assessment Tax Assessment Total Assessment is a certain percentage of the fair market value that is determined by local assessors to be the total taxable value of land and additions on the property. | Land | Improvement |
|---|---|---|---|---|
| 2025 | $2,457 | $17,948 | $3,327 | $14,621 |
| 2024 | $2,205 | $15,607 | $2,400 | $13,207 |
| 2023 | $2,261 | $15,607 | $2,400 | $13,207 |
| 2022 | $1,863 | $15,607 | $2,400 | $13,207 |
| 2021 | -- | $15,607 | $2,400 | $13,207 |
| 2020 | $1,767 | $15,607 | $0 | $0 |
| 2019 | $1,682 | $13,620 | $0 | $0 |
| 2018 | $1,690 | $13,620 | $0 | $0 |
| 2017 | $1,574 | $13,620 | $0 | $0 |
| 2016 | $1,483 | $13,620 | $0 | $0 |
| 2014 | $1,475 | $13,620 | $2,600 | $11,020 |
| 2013 | $1,475 | $21,570 | $2,700 | $18,870 |
Source: Public Records
Map
Nearby Homes
- 5834 Lake Wylie Rd
- 5981 Johnson Rd
- 770 Cooks Cove Ridge
- 6153 Barclay Ln
- 461 Swift Creek Cove
- 663 Highland Ridge Point
- 5549 Beaverdam Creek Rd
- 715 Cider Ct
- 3981 Serenity Now Way
- 15 Sandy Cove Rd
- 3708 Rivergrass Ln
- 407 Blue Bay Ct
- 2515 Watergarden St
- 3812 Arial Ln
- 1568 Whitman Ct
- 10 Thornwood Ct
- 3509 Aqua Point Dr
- 5418 Commodore Place
- 1326 Kings Grove Dr
- 1928 Thoreau Way
- 5876 Johnson Rd
- 5864 Johnson Rd
- 5858 Johnson Rd
- 5882 Johnson Rd
- 5871 Johnson Rd
- 5877 Johnson Rd
- 5865 Johnson Rd
- 5883 Johnson Rd
- 5888 Johnson Rd
- 5888 Johnson Rd Unit 62
- 5852 Johnson Rd
- 5859 Johnson Rd
- 5859 Johnson Rd Unit 1
- 739 Arrow Point Ct
- Lot 66 Johnson Rd
- 5889 Johnson Rd
- 5894 Johnson Rd
- (Lot 8) 708 Arrow Point Ct
- 708 Arrow Point Ct
- 723 Arrow Point Ct
Your Personal Tour Guide
Ask me questions while you tour the home.