Estimated Value: $422,000 - $446,000
4
Beds
2
Baths
1,536
Sq Ft
$282/Sq Ft
Est. Value
About This Home
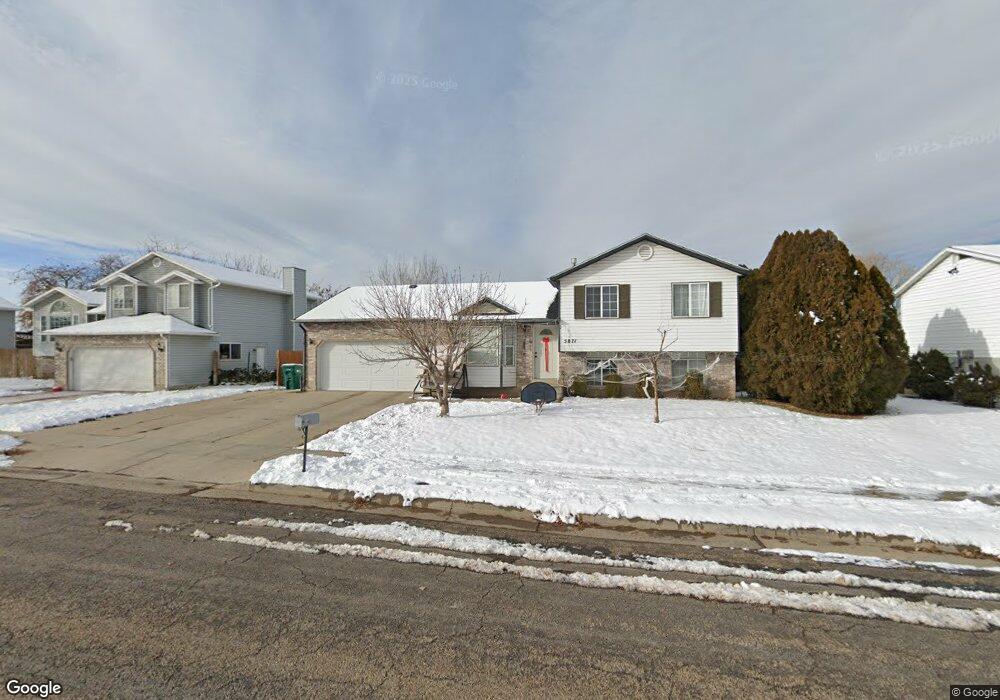
This home is located at 5871 S 4075 W, Roy, UT 84067 and is currently estimated at $433,097, approximately $281 per square foot. 5871 S 4075 W is a home located in Weber County with nearby schools including Freedom School, Roy Junior High School, and Roy High School.
Ownership History
Date
Name
Owned For
Owner Type
Purchase Details
Closed on
Jun 22, 2021
Sold by
Rennells Arthur James
Bought by
Rennells Arthur James and Rennells Faye Ann
Current Estimated Value
Home Financials for this Owner
Home Financials are based on the most recent Mortgage that was taken out on this home.
Original Mortgage
$23,565
Outstanding Balance
$21,345
Interest Rate
2.93%
Mortgage Type
New Conventional
Estimated Equity
$411,752
Purchase Details
Closed on
Sep 7, 2017
Sold by
Cordingly Cody M
Bought by
Cordingly Cody
Home Financials for this Owner
Home Financials are based on the most recent Mortgage that was taken out on this home.
Original Mortgage
$170,400
Interest Rate
3.92%
Mortgage Type
New Conventional
Purchase Details
Closed on
Aug 16, 2016
Sold by
Housing Management & Development Corpora
Bought by
Corwn At Watterson Llc
Purchase Details
Closed on
Jan 19, 2016
Sold by
Kanipe Jason D and Kanipe Ashley M
Bought by
Cordinagly Cody M
Home Financials for this Owner
Home Financials are based on the most recent Mortgage that was taken out on this home.
Original Mortgage
$168,150
Interest Rate
3.93%
Mortgage Type
New Conventional
Purchase Details
Closed on
Aug 29, 2008
Sold by
Hall Jacob J and Hall Diana M
Bought by
Kanipe Jason D and Kanipe Ashley M
Home Financials for this Owner
Home Financials are based on the most recent Mortgage that was taken out on this home.
Original Mortgage
$167,526
Interest Rate
6.59%
Mortgage Type
VA
Purchase Details
Closed on
Jun 16, 2004
Sold by
Federal National Mortgage Association
Bought by
Hall Jacob J and Hall Diana M
Home Financials for this Owner
Home Financials are based on the most recent Mortgage that was taken out on this home.
Original Mortgage
$121,001
Interest Rate
6.09%
Mortgage Type
Purchase Money Mortgage
Purchase Details
Closed on
Mar 18, 2004
Sold by
Aurora Loan Services Inc
Bought by
Federal National Mortgage Association
Purchase Details
Closed on
Mar 16, 2004
Sold by
Bernert Margot
Bought by
Aurora Loan Services Inc
Purchase Details
Closed on
Dec 14, 2001
Sold by
Bernert Carl J and Bernert Margo
Bought by
Bernert Margot
Home Financials for this Owner
Home Financials are based on the most recent Mortgage that was taken out on this home.
Original Mortgage
$114,300
Interest Rate
6.39%
Create a Home Valuation Report for This Property
The Home Valuation Report is an in-depth analysis detailing your home's value as well as a comparison with similar homes in the area
Home Values in the Area
Average Home Value in this Area
Purchase History
| Date | Buyer | Sale Price | Title Company |
|---|---|---|---|
| Rennells Arthur James | -- | Accommodation | |
| Rennells Arthur James | -- | Mountain View Titel | |
| Cordingly Cody | -- | First American Title | |
| Corwn At Watterson Llc | -- | First American | |
| Cordinagly Cody M | -- | Bay National Title Co | |
| Kanipe Jason D | -- | Bonneville Superior Title Co | |
| Hall Jacob J | $122,900 | U S Title Of Utah Ogden | |
| Federal National Mortgage Association | -- | Inwest Title | |
| Aurora Loan Services Inc | $129,749 | Inwest Title | |
| Bernert Margot | -- | Bonneville Title |
Source: Public Records
Mortgage History
| Date | Status | Borrower | Loan Amount |
|---|---|---|---|
| Open | Rennells Arthur James | $23,565 | |
| Open | Rennells Arthur James | $392,755 | |
| Previous Owner | Cordingly Cody | $170,400 | |
| Previous Owner | Cordinagly Cody M | $168,150 | |
| Previous Owner | Kanipe Jason D | $167,526 | |
| Previous Owner | Hall Jacob J | $121,001 | |
| Previous Owner | Bernert Margot | $114,300 |
Source: Public Records
Tax History Compared to Growth
Tax History
| Year | Tax Paid | Tax Assessment Tax Assessment Total Assessment is a certain percentage of the fair market value that is determined by local assessors to be the total taxable value of land and additions on the property. | Land | Improvement |
|---|---|---|---|---|
| 2025 | $2,336 | $413,848 | $135,000 | $278,848 |
| 2024 | $2,258 | $221,649 | $74,257 | $147,392 |
| 2023 | $2,103 | $206,800 | $65,968 | $140,832 |
| 2022 | $2,323 | $232,650 | $60,501 | $172,149 |
| 2021 | $1,805 | $300,000 | $80,017 | $219,983 |
| 2020 | $1,669 | $254,000 | $80,017 | $173,983 |
| 2019 | $1,732 | $249,000 | $45,048 | $203,952 |
| 2018 | $1,596 | $217,000 | $39,924 | $177,076 |
| 2017 | $1,491 | $191,000 | $39,924 | $151,076 |
| 2016 | $1,412 | $97,531 | $21,415 | $76,116 |
| 2015 | $1,213 | $86,422 | $21,415 | $65,007 |
| 2014 | $1,111 | $78,263 | $18,611 | $59,652 |
Source: Public Records
Map
Nearby Homes
- 5865 S 4075 W
- 5887 S 4075 W
- 5902 S 4150 W Unit 35
- 5902 S 4150 W
- 5884 S 4150 W
- 5884 S 4150 W Unit 34
- 5859 S 4075 W
- 5872 S 4075 W
- 5914 S 4150 W Unit 36
- 5914 S 4150 W
- 5868 S 4150 W
- 5868 S 4150 W Unit 33
- 5866 S 4075 W
- 5888 S 4075 W
- 5860 S 4075 W
- 5927 S 4075 W
- 5843 S 4075 W
- 5906 S 4075 W
- 5858 S 4150 W
- 5920 S 4150 W Unit 37