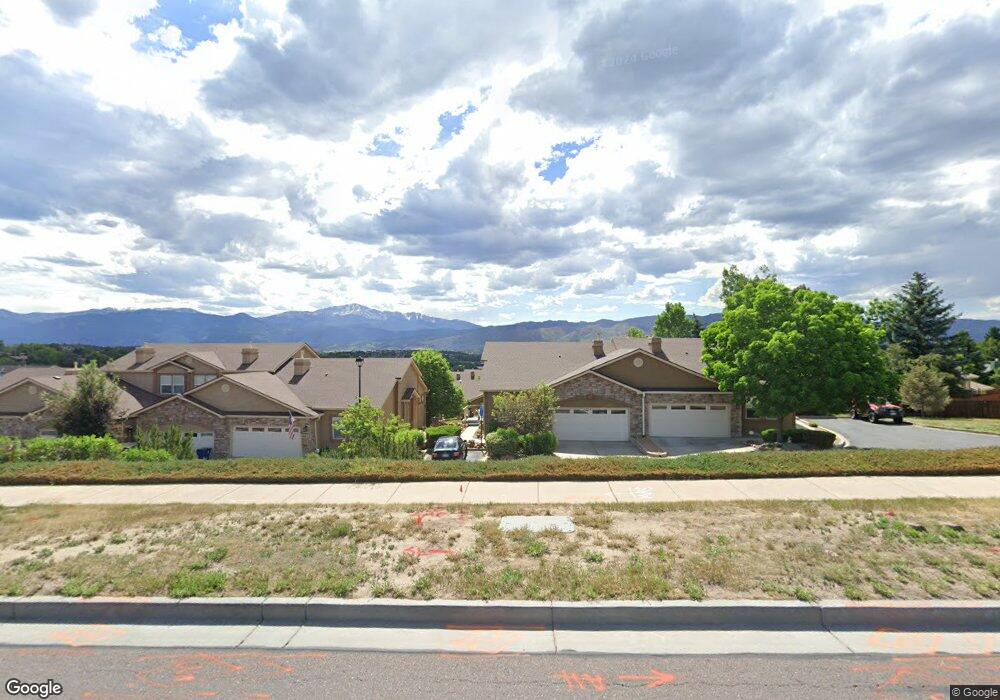
5872 New Crossings Point Colorado Springs, CO 80918
Pulpit Rock NeighborhoodEstimated Value: $342,000 - $408,000
2
Beds
3
Baths
1,486
Sq Ft
$251/Sq Ft
Est. Value
About This Home
This home is located at 5872 New Crossings Point, Colorado Springs, CO 80918 and is currently estimated at $373,524, approximately $251 per square foot. 5872 New Crossings Point is a home located in El Paso County with nearby schools including King Elementary School, Russell Middle School, and Coronado High School.
Ownership History
Date
Name
Owned For
Owner Type
Purchase Details
Closed on
May 11, 2016
Sold by
Buechner Thomas and Buechner Heidi
Bought by
The Thdive Trust
Current Estimated Value
Purchase Details
Closed on
Jul 26, 2013
Sold by
Snyder Michael J and Snyder Tempe E
Bought by
Buechner Thomas and Buechner Heidi
Home Financials for this Owner
Home Financials are based on the most recent Mortgage that was taken out on this home.
Original Mortgage
$142,500
Outstanding Balance
$34,748
Interest Rate
3.99%
Mortgage Type
New Conventional
Estimated Equity
$338,776
Purchase Details
Closed on
Jun 14, 2004
Sold by
Union Homes Llc
Bought by
Snyder Michael J and Snyder Tempe E
Home Financials for this Owner
Home Financials are based on the most recent Mortgage that was taken out on this home.
Original Mortgage
$135,920
Interest Rate
6.12%
Mortgage Type
Unknown
Create a Home Valuation Report for This Property
The Home Valuation Report is an in-depth analysis detailing your home's value as well as a comparison with similar homes in the area
Home Values in the Area
Average Home Value in this Area
Purchase History
| Date | Buyer | Sale Price | Title Company |
|---|---|---|---|
| The Thdive Trust | -- | None Available | |
| Buechner Thomas | $190,000 | Heritage Title | |
| Snyder Michael J | $169,900 | -- |
Source: Public Records
Mortgage History
| Date | Status | Borrower | Loan Amount |
|---|---|---|---|
| Open | Buechner Thomas | $142,500 | |
| Previous Owner | Snyder Michael J | $135,920 |
Source: Public Records
Tax History Compared to Growth
Tax History
| Year | Tax Paid | Tax Assessment Tax Assessment Total Assessment is a certain percentage of the fair market value that is determined by local assessors to be the total taxable value of land and additions on the property. | Land | Improvement |
|---|---|---|---|---|
| 2025 | $1,136 | $26,330 | -- | -- |
| 2024 | $1,025 | $24,840 | $5,700 | $19,140 |
| 2023 | $1,025 | $24,840 | $5,700 | $19,140 |
| 2022 | $1,139 | $20,360 | $3,820 | $16,540 |
| 2021 | $1,236 | $20,950 | $3,930 | $17,020 |
| 2020 | $1,171 | $17,250 | $3,070 | $14,180 |
| 2019 | $1,164 | $17,250 | $3,070 | $14,180 |
| 2018 | $1,142 | $15,560 | $2,340 | $13,220 |
| 2017 | $1,081 | $15,560 | $2,340 | $13,220 |
| 2016 | $869 | $14,990 | $2,390 | $12,600 |
| 2015 | $866 | $14,990 | $2,390 | $12,600 |
| 2014 | $766 | $12,730 | $2,230 | $10,500 |
Source: Public Records
Map
Nearby Homes
- 5803 New Crossings Point
- 2690 Maroon Bells Ave
- 2642 Lynbarton Point
- 6205 MacH 1 Dr
- 2920 Garmish Place
- 5520 Fiesta Ln
- 5702 Tuckerman Ln
- 2815 Downhill Dr
- 6035 Tuckerman Ln
- 2810 Downhill Dr
- 5888 Eldora Dr
- 6215 Lange Dr
- 2724 Montebello Dr W
- 6041 Kingdom View
- 5850 Del Paz Dr
- 5915 Eldora Ln
- 5609 Little Nell Ct
- 2910 Downhill Dr
- 3124 Squaw Valley Dr
- 3287 Squaw Valley Dr
- 5868 New Crossings Point
- 5876 New Crossings Point
- 5864 New Crossings Point
- 5860 New Crossings Point
- 2682 Avalanche Heights
- 2690 Avalanche Heights
- 2674 Avalanche Heights
- 5856 New Crossings Point
- 2698 Avalanche Heights
- 2706 Avalanche Heights
- 5867 New Crossings Point
- 5871 New Crossings Point
- 5863 New Crossings Point
- 2745 Maroon Bells Ave
- 5859 New Crossings Point
- 2735 Maroon Bells Ave
- 5852 New Crossings Point
- 2755 Maroon Bells Ave
- 5848 New Crossings Point
- 2725 Maroon Bells Ave