Estimated Value: $353,000 - $405,000
2
Beds
1
Bath
1,572
Sq Ft
$238/Sq Ft
Est. Value
About This Home
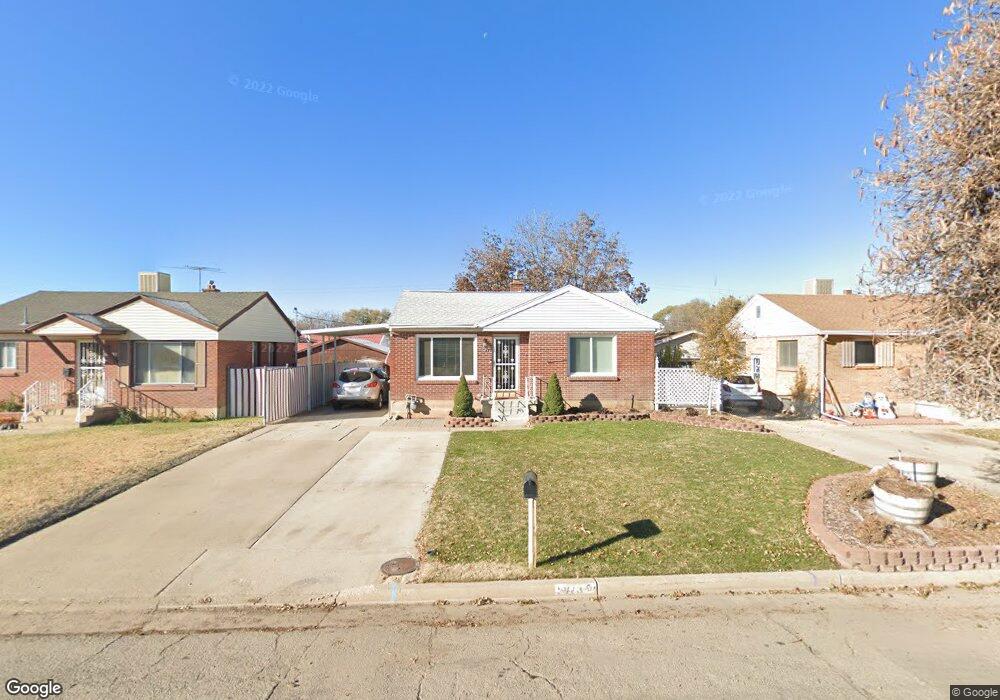
This home is located at 5873 S 2600 W, Roy, UT 84067 and is currently estimated at $374,449, approximately $238 per square foot. 5873 S 2600 W is a home located in Weber County with nearby schools including Roy Elementary School, Roy Junior High School, and Roy High School.
Ownership History
Date
Name
Owned For
Owner Type
Purchase Details
Closed on
Aug 17, 2017
Sold by
Call Nicholas K
Bought by
Jaramillo Alexis M
Current Estimated Value
Home Financials for this Owner
Home Financials are based on the most recent Mortgage that was taken out on this home.
Original Mortgage
$151,900
Outstanding Balance
$126,749
Interest Rate
3.96%
Mortgage Type
New Conventional
Estimated Equity
$247,700
Purchase Details
Closed on
Jun 4, 2012
Sold by
Thorpe Patricia Ann and Smith Wayne M
Bought by
Call Nicholas K
Create a Home Valuation Report for This Property
The Home Valuation Report is an in-depth analysis detailing your home's value as well as a comparison with similar homes in the area
Home Values in the Area
Average Home Value in this Area
Purchase History
| Date | Buyer | Sale Price | Title Company |
|---|---|---|---|
| Jaramillo Alexis M | -- | Investors Title Ins Agency | |
| Call Nicholas K | -- | American Preferred Title |
Source: Public Records
Mortgage History
| Date | Status | Borrower | Loan Amount |
|---|---|---|---|
| Open | Jaramillo Alexis M | $151,900 |
Source: Public Records
Tax History Compared to Growth
Tax History
| Year | Tax Paid | Tax Assessment Tax Assessment Total Assessment is a certain percentage of the fair market value that is determined by local assessors to be the total taxable value of land and additions on the property. | Land | Improvement |
|---|---|---|---|---|
| 2025 | $1,961 | $345,901 | $95,215 | $250,686 |
| 2024 | $1,891 | $184,799 | $52,376 | $132,423 |
| 2023 | $1,753 | $171,600 | $53,638 | $117,962 |
| 2022 | $2,008 | $200,200 | $49,858 | $150,342 |
| 2021 | $1,548 | $256,000 | $58,268 | $197,732 |
| 2020 | $1,367 | $207,000 | $58,268 | $148,732 |
| 2019 | $1,308 | $187,000 | $34,683 | $152,317 |
| 2018 | $1,132 | $153,000 | $30,008 | $122,992 |
| 2017 | $958 | $122,000 | $30,008 | $91,992 |
| 2016 | $954 | $65,521 | $17,228 | $48,293 |
| 2015 | $803 | $56,866 | $19,813 | $37,053 |
| 2014 | $789 | $55,193 | $14,630 | $40,563 |
Source: Public Records
Map
Nearby Homes
- 2587 W 5750 S
- 2571 W 5725 S
- 2672 W 5750 S
- 5810 S 2550 W
- 2646 W 5625 S Unit M-2646
- 2829 W 5925 S
- 2907 W 5775 S
- 5568 S 2800 W Unit 5B
- 2778 W 5550 S Unit 28
- 2786 W 5550 S Unit C11
- 484 W 2650 N
- 2995 W 5750 S
- 480 W 2650 N
- 3027 W 2600 N
- 3033 W 2600 N
- 3068 W 2600 N
- 2635 N 500 W Unit 45
- 2612 N 525 W
- 5643 S 2200 W
- 2593 N 500 W Unit 56