5873 Swan Point Place Las Vegas, NV 89122
Estimated Value: $397,684 - $441,000
3
Beds
2
Baths
1,622
Sq Ft
$257/Sq Ft
Est. Value
About This Home
This home is located at 5873 Swan Point Place, Las Vegas, NV 89122 and is currently estimated at $417,171, approximately $257 per square foot. 5873 Swan Point Place is a home located in Clark County with nearby schools including Cynthia Cunningham Elementary School, Kathleen & Tim Harney Middle School, and Chaparral High School.
Ownership History
Date
Name
Owned For
Owner Type
Purchase Details
Closed on
Mar 16, 2020
Sold by
Hall Harriet F
Bought by
Hall Harriet F and Harriet F Hall Trust
Current Estimated Value
Purchase Details
Closed on
Aug 23, 2002
Sold by
Hall C Frank and Hall Harriet
Bought by
Hall C Frank and Hall Harriet F
Home Financials for this Owner
Home Financials are based on the most recent Mortgage that was taken out on this home.
Original Mortgage
$114,500
Outstanding Balance
$44,345
Interest Rate
5.37%
Estimated Equity
$372,826
Purchase Details
Closed on
Mar 23, 2001
Sold by
William Lyon Homes Inc
Bought by
Hall C Frank and Hall Harriet
Home Financials for this Owner
Home Financials are based on the most recent Mortgage that was taken out on this home.
Original Mortgage
$106,600
Interest Rate
7.06%
Create a Home Valuation Report for This Property
The Home Valuation Report is an in-depth analysis detailing your home's value as well as a comparison with similar homes in the area
Home Values in the Area
Average Home Value in this Area
Purchase History
| Date | Buyer | Sale Price | Title Company |
|---|---|---|---|
| Hall Harriet F | -- | None Available | |
| Hall C Frank | -- | United Title | |
| Hall C Frank | $166,615 | Fidelity National Title |
Source: Public Records
Mortgage History
| Date | Status | Borrower | Loan Amount |
|---|---|---|---|
| Open | Hall C Frank | $114,500 | |
| Closed | Hall C Frank | $106,600 |
Source: Public Records
Tax History Compared to Growth
Tax History
| Year | Tax Paid | Tax Assessment Tax Assessment Total Assessment is a certain percentage of the fair market value that is determined by local assessors to be the total taxable value of land and additions on the property. | Land | Improvement |
|---|---|---|---|---|
| 2025 | $1,833 | $101,673 | $32,340 | $69,333 |
| 2024 | $1,780 | $101,673 | $32,340 | $69,333 |
| 2023 | $1,780 | $99,219 | $33,495 | $65,724 |
| 2022 | $1,729 | $88,505 | $28,490 | $60,015 |
| 2021 | $1,678 | $84,025 | $26,950 | $57,075 |
| 2020 | $1,627 | $80,773 | $24,255 | $56,518 |
| 2019 | $1,579 | $79,910 | $24,255 | $55,655 |
| 2018 | $1,507 | $70,974 | $17,325 | $53,649 |
| 2017 | $2,091 | $71,104 | $16,940 | $54,164 |
| 2016 | $1,411 | $62,288 | $13,563 | $48,725 |
| 2015 | $1,408 | $54,170 | $13,563 | $40,607 |
| 2014 | $1,367 | $45,035 | $8,750 | $36,285 |
Source: Public Records
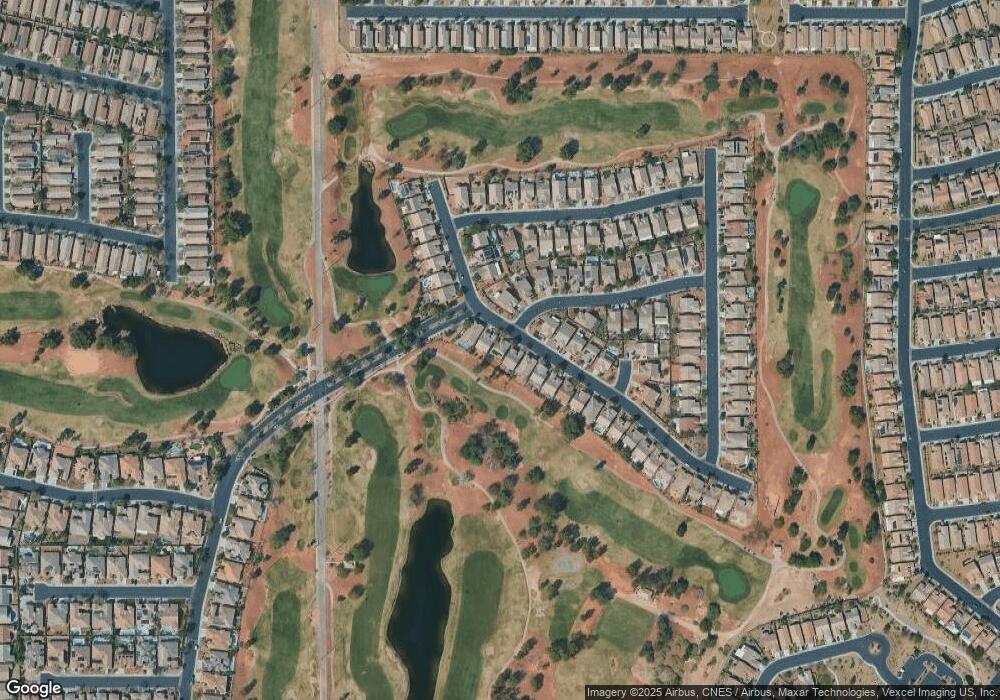
Map
Nearby Homes
- 5926 Terra Grande Ave
- 5829 Swan Point Place
- 3591 Driving Range St
- 5969 Swan Point Place Unit 1
- 3562 Driving Range St
- 5968 Pavilion Lakes Ave
- 3490 Old Course St
- 5963 Crossfield Ave
- 3385 Blue Ribbon Downs St
- 3447 Halter Dr
- 5678 Sunningdale Ct Unit 1
- 3354 Blue Ribbon Downs St
- 5679 Sunningdale Ct
- 6092 Fox Creek Ave
- 5935 Saddle Horse Ave
- 5977 Falconer Ave
- 6128 Isola Peak Ave
- 6085 Majestic Wind Ave
- 3306 American Mustang Ct
- 3735 Halter Dr
- 5865 Swan Point Place
- 5881 Swan Point Place
- 5889 Swan Point Place Unit 1
- 5857 Swan Point Place
- 5897 Swan Point Place
- 5897 Swan Point Place Unit n/a
- 5886 Terra Grande Ave
- 5884 Swan Point Place
- 5905 Swan Point Place
- 5898 Swan Point Place
- 5894 Terra Grande Ave
- 5850 Swan Point Place Unit 2
- 5904 Swan Point Place
- 5913 Swan Point Place Unit 1
- 5853 Swan Point Place
- 5902 Terra Grande Ave
- 5914 Swan Point Place
- 5849 Swan Point Place
- 5921 Swan Point Place
- 5846 Swan Point Place