Estimated Value: $426,000 - $456,242
--
Bed
3
Baths
2,887
Sq Ft
$151/Sq Ft
Est. Value
About This Home
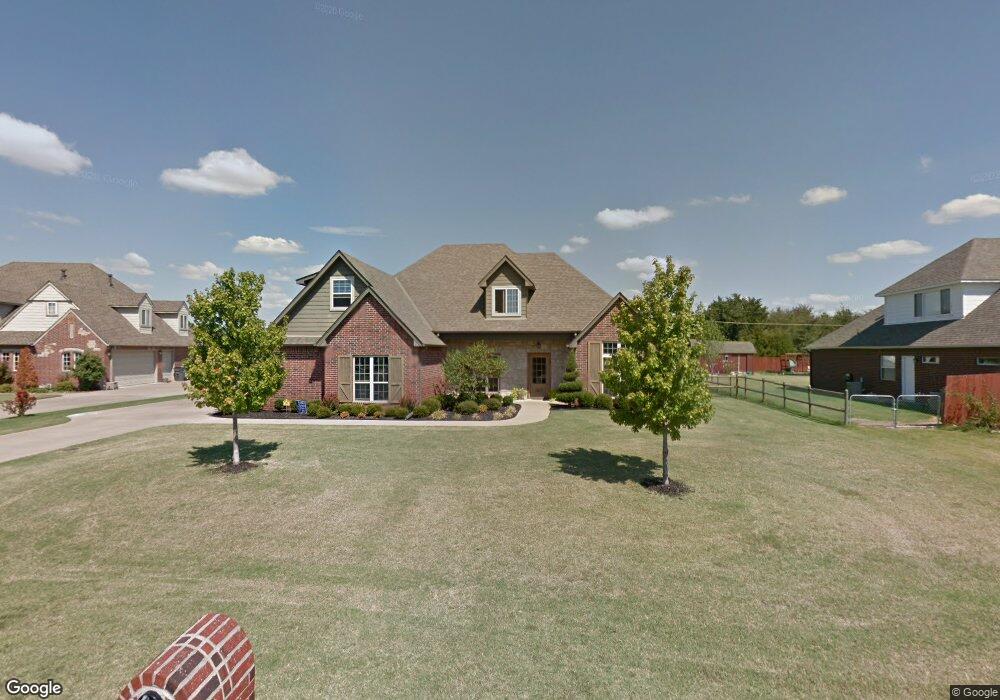
This home is located at 5875 E 164th St S, Bixby, OK 74008 and is currently estimated at $437,311, approximately $151 per square foot. 5875 E 164th St S is a home located in Tulsa County with nearby schools including Central Elementary School, Bixby Central Intermediate School, and Bixby Middle School.
Ownership History
Date
Name
Owned For
Owner Type
Purchase Details
Closed on
Sep 23, 2019
Sold by
Burks Charles and Burks Cynthia D
Bought by
Pancoast Chad R and Pancoast Tausha M
Current Estimated Value
Home Financials for this Owner
Home Financials are based on the most recent Mortgage that was taken out on this home.
Original Mortgage
$236,000
Outstanding Balance
$206,718
Interest Rate
3.6%
Mortgage Type
New Conventional
Estimated Equity
$230,593
Purchase Details
Closed on
May 26, 2006
Sold by
Garden Trail Homes Inc
Bought by
Burks Charles and Burks Cynthia D
Home Financials for this Owner
Home Financials are based on the most recent Mortgage that was taken out on this home.
Original Mortgage
$252,400
Interest Rate
6.56%
Mortgage Type
Fannie Mae Freddie Mac
Create a Home Valuation Report for This Property
The Home Valuation Report is an in-depth analysis detailing your home's value as well as a comparison with similar homes in the area
Home Values in the Area
Average Home Value in this Area
Purchase History
| Date | Buyer | Sale Price | Title Company |
|---|---|---|---|
| Pancoast Chad R | $295,000 | First American Title Ins Co | |
| Burks Charles | $253,000 | First American Title & Abstr |
Source: Public Records
Mortgage History
| Date | Status | Borrower | Loan Amount |
|---|---|---|---|
| Open | Pancoast Chad R | $236,000 | |
| Previous Owner | Burks Charles | $252,400 |
Source: Public Records
Tax History Compared to Growth
Tax History
| Year | Tax Paid | Tax Assessment Tax Assessment Total Assessment is a certain percentage of the fair market value that is determined by local assessors to be the total taxable value of land and additions on the property. | Land | Improvement |
|---|---|---|---|---|
| 2024 | $4,676 | $34,459 | $2,966 | $31,493 |
| 2023 | $4,676 | $34,426 | $3,377 | $31,049 |
| 2022 | $4,556 | $32,424 | $3,616 | $28,808 |
| 2021 | $4,130 | $31,450 | $3,507 | $27,943 |
| 2020 | $4,156 | $31,450 | $3,507 | $27,943 |
| 2019 | $3,692 | $27,830 | $3,619 | $24,211 |
| 2018 | $3,658 | $27,830 | $3,619 | $24,211 |
| 2017 | $3,634 | $27,830 | $3,619 | $24,211 |
| 2016 | $3,590 | $27,830 | $3,619 | $24,211 |
| 2015 | $3,434 | $27,830 | $3,619 | $24,211 |
| 2014 | $3,428 | $27,830 | $3,619 | $24,211 |
Source: Public Records
Map
Nearby Homes
- 16412 S Irvington Ave
- 13915 S Joplin St S
- 5892 E 165th St S
- 226 E 165th St
- 102 E 165th St
- 215 E 165th St
- 16508 S Yale Ave
- 17096 S Yale Ave
- 6440 E 171st St S
- 5502 E 174th St S
- 5549 E 174th St S
- 4903 E 174th St S
- 15920 S 74th East Ave
- 7407 E 160th St S
- 7513 E 160th St S
- Plan 2349+ at Magnolia
- Plan 2349 at Magnolia
- Plan 2608 at Magnolia
- Plan 2625 at Magnolia
- Plan 2608+ at Magnolia
- 897253 S Irvington Ave
- 5879 E 164th St S
- 5871 E 164th St S
- 16403 S Irvington Ave
- 5883 E 164th St S
- 5868 E 164th St S
- 16404 S Joplin Ave
- 16402 S Irvington Ave
- 16407 S Irvington Ave
- 5905 E 164th St S
- 16408 S Joplin Ave
- 16406 S Irvington Ave
- 16411 S Irvington Ave
- 16410 S Joplin Ave
- 16410 S Irvington Ave
- 5915 E 164th St S
- 16405 S Joplin Ave
- 16415 S Irvington Ave
- 16414 S Joplin Ave
- 16415 S Joplin Ave