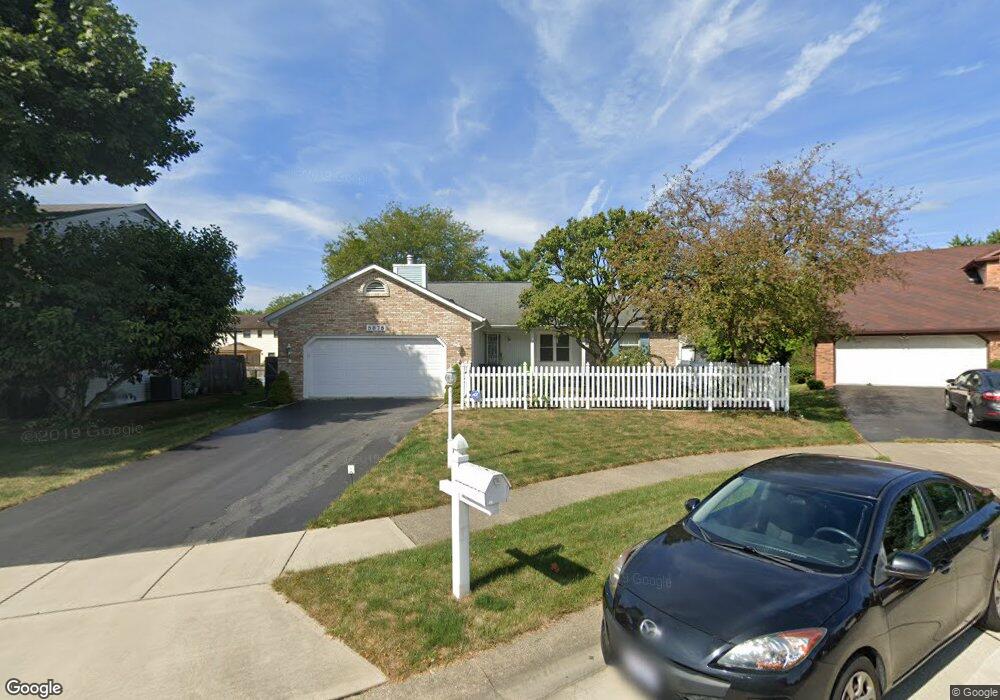
5875 Mall View Ct Columbus, OH 43231
Northern Woods NeighborhoodEstimated Value: $295,881 - $343,000
3
Beds
2
Baths
1,344
Sq Ft
$237/Sq Ft
Est. Value
About This Home
This home is located at 5875 Mall View Ct, Columbus, OH 43231 and is currently estimated at $317,970, approximately $236 per square foot. 5875 Mall View Ct is a home located in Franklin County with nearby schools including Huber Ridge Elementary School, Walnut Springs Middle School, and Westerville Central High School.
Ownership History
Date
Name
Owned For
Owner Type
Purchase Details
Closed on
Jan 1, 2000
Sold by
Runyon Rick G
Bought by
Runyon Rick G and Runyon Glenna Sue
Current Estimated Value
Home Financials for this Owner
Home Financials are based on the most recent Mortgage that was taken out on this home.
Original Mortgage
$124,898
Outstanding Balance
$39,129
Interest Rate
7.87%
Mortgage Type
FHA
Estimated Equity
$278,842
Purchase Details
Closed on
Dec 14, 1999
Sold by
Culp David W and Culp Geneva M
Bought by
Runyon Rick G
Home Financials for this Owner
Home Financials are based on the most recent Mortgage that was taken out on this home.
Original Mortgage
$124,898
Outstanding Balance
$39,129
Interest Rate
7.87%
Mortgage Type
FHA
Estimated Equity
$278,842
Purchase Details
Closed on
Jun 20, 1979
Bought by
Culp David W and Culp Geneva M
Create a Home Valuation Report for This Property
The Home Valuation Report is an in-depth analysis detailing your home's value as well as a comparison with similar homes in the area
Home Values in the Area
Average Home Value in this Area
Purchase History
| Date | Buyer | Sale Price | Title Company |
|---|---|---|---|
| Runyon Rick G | -- | -- | |
| Runyon Rick G | $125,000 | Chicago Title | |
| Culp David W | $68,400 | -- |
Source: Public Records
Mortgage History
| Date | Status | Borrower | Loan Amount |
|---|---|---|---|
| Open | Runyon Rick G | $124,898 |
Source: Public Records
Tax History Compared to Growth
Tax History
| Year | Tax Paid | Tax Assessment Tax Assessment Total Assessment is a certain percentage of the fair market value that is determined by local assessors to be the total taxable value of land and additions on the property. | Land | Improvement |
|---|---|---|---|---|
| 2024 | $3,370 | $77,420 | $19,600 | $57,820 |
| 2023 | $3,319 | $77,420 | $19,600 | $57,820 |
| 2022 | $3,240 | $59,610 | $13,060 | $46,550 |
| 2021 | $3,272 | $59,610 | $13,060 | $46,550 |
| 2020 | $3,261 | $59,610 | $13,060 | $46,550 |
| 2019 | $2,616 | $47,670 | $10,430 | $37,240 |
| 2018 | $2,580 | $47,670 | $10,430 | $37,240 |
| 2017 | $2,564 | $47,670 | $10,430 | $37,240 |
| 2016 | $2,598 | $44,730 | $10,500 | $34,230 |
| 2015 | $2,604 | $44,730 | $10,500 | $34,230 |
| 2014 | $2,606 | $44,730 | $10,500 | $34,230 |
| 2013 | $1,383 | $47,075 | $11,060 | $36,015 |
Source: Public Records
Map
Nearby Homes
- 2800 Overview Ct Unit 2800B
- 5841 Forest Hills Blvd Unit 5843
- 3001 Cooper Bluff Dr Unit 3001
- 2677-2679 Blossom Ave
- 5678 Great Hall Ct Unit 12C
- 2727 Patrick Ave
- 2981 Blendon Woods Blvd Unit 983
- 3038 Highcliff Ct
- 3070 Highcliff Ct Unit 3070
- 3068 Highcliff Ct Unit 3068
- 5681 Oliver St
- 5670 Oliver St
- 5600 Cartwright Ln Unit 19
- 2721 Woodland Trail Dr Unit 2721
- 3066 Ravine Pointe Dr Unit 3066
- 3129 Rainier Ave
- 3104 Palomar Ave
- 3160 Adirondack Ave
- 3090 Shasta Ave Unit 92
- 3140 Palomar Ave
- 5867 Mall View Ct
- 5887 Mall View Ct
- 5884 Ravine View Ct
- 5876 Ravine View Ct
- 5859 Mall View Ct
- 5864 Ravine View Ct
- 5893 Mall View Ct
- 5868 Mallview Ct
- 5890 Ravine View Ct
- 5868 Mall View Ct
- 5856 Ravine View Ct
- 5860 Mall View Ct
- 5851 Mall View Ct
- 5851 Mallview Ct
- 5876 Mall View Ct
- 5850 Mallview Ct
- 5846 Ravine View Ct Unit 5846 Ravine View Cou
- 5884 Mall View Ct
- 5850 Mall View Ct
- 5780 Lou St