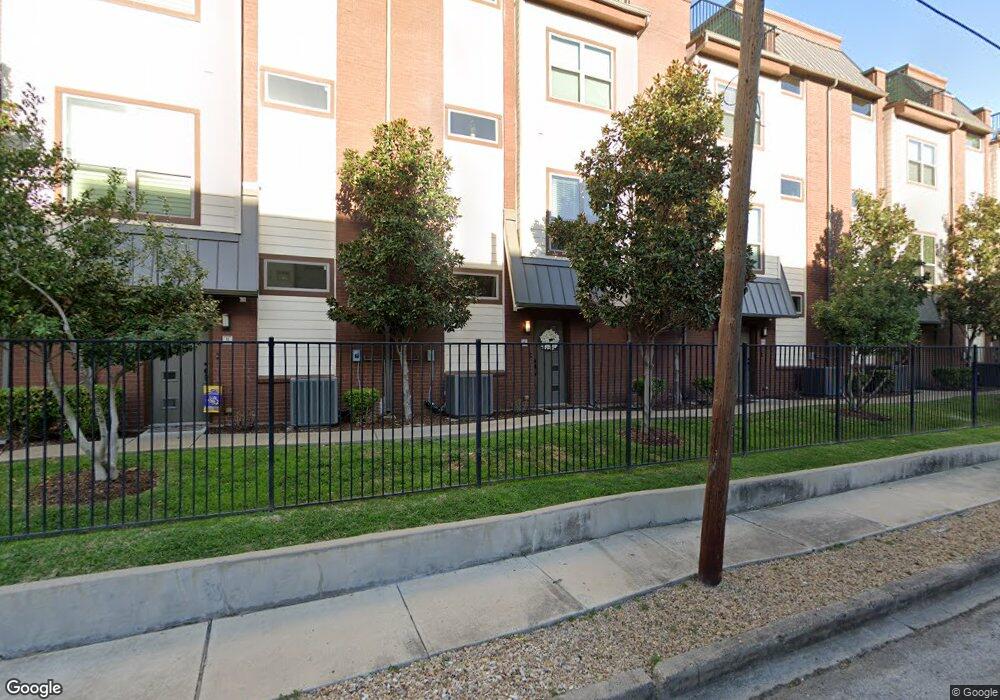
5875 Ross Ave Unit 4 Dallas, TX 75206
Lower Greenville NeighborhoodEstimated Value: $485,593 - $507,000
2
Beds
3
Baths
1,448
Sq Ft
$344/Sq Ft
Est. Value
About This Home
This home is located at 5875 Ross Ave Unit 4, Dallas, TX 75206 and is currently estimated at $497,898, approximately $343 per square foot. 5875 Ross Ave Unit 4 is a home located in Dallas County with nearby schools including J L Long Middle School, Woodrow Wilson High School, and Uplift Peak Preparatory High School.
Ownership History
Date
Name
Owned For
Owner Type
Purchase Details
Closed on
Oct 22, 2018
Sold by
Winters Anne
Bought by
Swalm Ryan E
Current Estimated Value
Home Financials for this Owner
Home Financials are based on the most recent Mortgage that was taken out on this home.
Original Mortgage
$315,000
Outstanding Balance
$274,699
Interest Rate
4.5%
Mortgage Type
Purchase Money Mortgage
Estimated Equity
$223,199
Purchase Details
Closed on
Mar 10, 2016
Sold by
Lange Courtney
Bought by
Winters Anne
Home Financials for this Owner
Home Financials are based on the most recent Mortgage that was taken out on this home.
Original Mortgage
$264,800
Interest Rate
3.79%
Mortgage Type
New Conventional
Purchase Details
Closed on
Apr 2, 2015
Sold by
Matilda Apartments Lp
Bought by
Lange Courtney
Home Financials for this Owner
Home Financials are based on the most recent Mortgage that was taken out on this home.
Original Mortgage
$240,400
Interest Rate
3.82%
Mortgage Type
New Conventional
Create a Home Valuation Report for This Property
The Home Valuation Report is an in-depth analysis detailing your home's value as well as a comparison with similar homes in the area
Home Values in the Area
Average Home Value in this Area
Purchase History
| Date | Buyer | Sale Price | Title Company |
|---|---|---|---|
| Swalm Ryan E | -- | None Available | |
| Winters Anne | -- | Chicago Title | |
| Lange Courtney | -- | Chicago Title |
Source: Public Records
Mortgage History
| Date | Status | Borrower | Loan Amount |
|---|---|---|---|
| Open | Swalm Ryan E | $315,000 | |
| Previous Owner | Winters Anne | $264,800 | |
| Previous Owner | Lange Courtney | $240,400 |
Source: Public Records
Tax History Compared to Growth
Tax History
| Year | Tax Paid | Tax Assessment Tax Assessment Total Assessment is a certain percentage of the fair market value that is determined by local assessors to be the total taxable value of land and additions on the property. | Land | Improvement |
|---|---|---|---|---|
| 2025 | $7,735 | $470,010 | $101,410 | $368,600 |
| 2024 | $7,735 | $470,010 | $101,410 | $368,600 |
| 2023 | $7,735 | $427,160 | $93,610 | $333,550 |
| 2022 | $7,656 | $427,160 | $0 | $0 |
| 2021 | $9,168 | $347,520 | $70,210 | $277,310 |
| 2020 | $9,428 | $347,520 | $70,210 | $277,310 |
| 2019 | $9,517 | $334,490 | $62,410 | $272,080 |
| 2018 | $9,095 | $334,490 | $24,960 | $309,530 |
| 2017 | $9,096 | $334,490 | $24,960 | $309,530 |
| 2016 | $8,420 | $309,650 | $24,960 | $284,690 |
Source: Public Records
Map
Nearby Homes
- 5909 Ross Ave Unit 2
- 5875 Ross Ave Unit 6
- 5838 La Vista Dr
- 5810 Hudson St
- 6020 Hudson St Unit 6
- 5963 Ross Ave Unit 103
- 5963 Ross Ave Unit 101
- 5963 Ross Ave Unit 202
- 6100 Hudson St Unit 3
- 5966 Ross Ave
- 5609 Lewis St
- 5830 La Vista Ct
- 5805 Lindell Ave Unit 101
- 5647 Live Oak St
- 5705 Live Oak St Unit B
- 5620 Live Oak St Unit 104
- 5816 Lindell Ave Unit 3
- 2002 Matilda St
- 5713 La Vista Dr
- 1909 Hope Way
- 5875 Ross Ave
- 5875 Ross Ave Unit 10
- 5875 Ross Ave Unit 5
- 5875 Ross Ave Unit 9
- 5875 Ross Ave Unit 12
- 5875 Ross Ave Unit 11
- 5875 Ross Ave Unit 2
- 5875 Ross Ave Unit 7
- 5875 Ross Ave Unit 8
- 5809 Ross Ave
- 5815 Ross Ave
- 1711 Hubert St
- 1712 Mary St
- 5803 Ross Ave Unit C
- 5803 Ross Ave Unit D
- 5803 Ross Ave Unit A
- 5803 Ross Ave
- 5801 Ross Ave Unit D
- 5801 Ross Ave Unit B
- 5801 Ross Ave Unit A