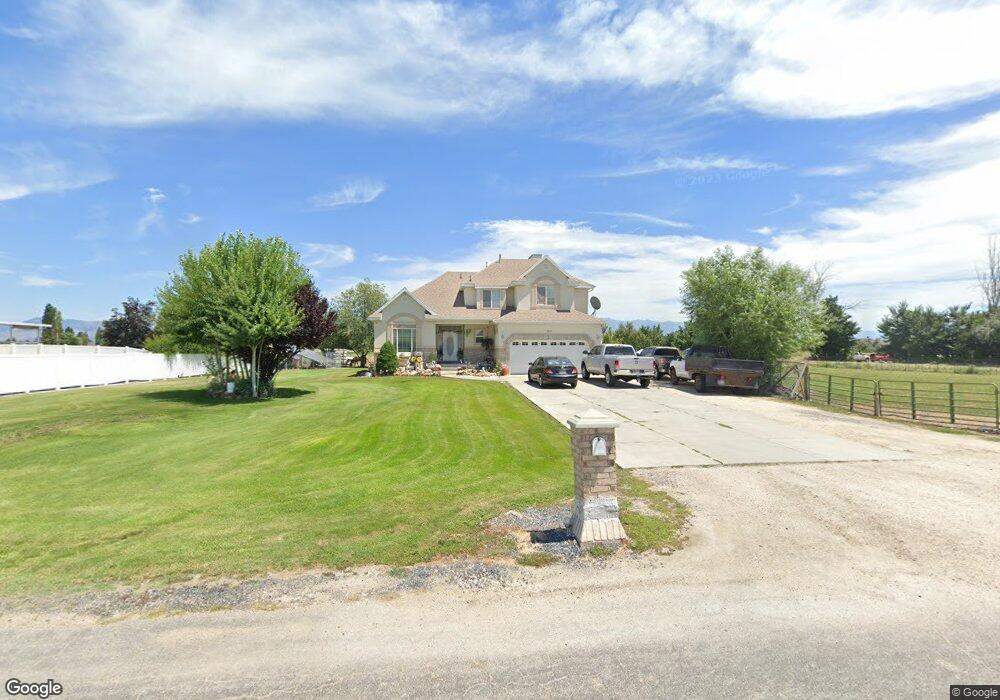
5876 S 6950 W Hooper, UT 84315
Estimated Value: $757,000 - $800,155
5
Beds
4
Baths
3,238
Sq Ft
$241/Sq Ft
Est. Value
About This Home
This home is located at 5876 S 6950 W, Hooper, UT 84315 and is currently estimated at $781,539, approximately $241 per square foot. 5876 S 6950 W is a home located in Weber County with nearby schools including Hooper Elementary School and Rocky Mountain Junior High School.
Ownership History
Date
Name
Owned For
Owner Type
Purchase Details
Closed on
May 17, 2024
Sold by
Rodriguez Francisco N and Rodriguez Maria G
Bought by
Rodriguez Francisco and Rodriguez Maria Guadalupe
Current Estimated Value
Home Financials for this Owner
Home Financials are based on the most recent Mortgage that was taken out on this home.
Original Mortgage
$519,000
Outstanding Balance
$509,692
Interest Rate
6.82%
Mortgage Type
New Conventional
Estimated Equity
$271,847
Purchase Details
Closed on
Jul 19, 2023
Sold by
Vanburen Travis Clark
Bought by
Clark And Robyn Van Buren Family Trust and Van Buren
Purchase Details
Closed on
Aug 3, 2016
Sold by
Neese Matthew L and Neese Diane
Bought by
Rodriguez Francisco
Home Financials for this Owner
Home Financials are based on the most recent Mortgage that was taken out on this home.
Original Mortgage
$242,000
Interest Rate
3.56%
Mortgage Type
New Conventional
Purchase Details
Closed on
Jul 29, 2016
Sold by
Rodriguez Francisco
Bought by
Rodriguz Franciso N and Rodriguz Maria G
Home Financials for this Owner
Home Financials are based on the most recent Mortgage that was taken out on this home.
Original Mortgage
$242,000
Interest Rate
3.56%
Mortgage Type
New Conventional
Purchase Details
Closed on
Feb 29, 2008
Sold by
Rodriquez Francisco N and Rodriquez Maria G
Bought by
Rodriguez Francisco N and Rodriguez Maria G
Home Financials for this Owner
Home Financials are based on the most recent Mortgage that was taken out on this home.
Original Mortgage
$264,000
Interest Rate
5.41%
Mortgage Type
Purchase Money Mortgage
Purchase Details
Closed on
Jul 13, 2007
Sold by
Hill Curtis L and Hill Verlyn
Bought by
Rodriguez Francisco N and Rodriguez Maria G
Home Financials for this Owner
Home Financials are based on the most recent Mortgage that was taken out on this home.
Original Mortgage
$259,000
Interest Rate
6.41%
Mortgage Type
Purchase Money Mortgage
Purchase Details
Closed on
Oct 20, 2000
Sold by
Mark Higley Construction Lc
Bought by
Hill Curtis L and Hill Verlyn
Home Financials for this Owner
Home Financials are based on the most recent Mortgage that was taken out on this home.
Original Mortgage
$200,000
Interest Rate
7.89%
Mortgage Type
Construction
Create a Home Valuation Report for This Property
The Home Valuation Report is an in-depth analysis detailing your home's value as well as a comparison with similar homes in the area
Home Values in the Area
Average Home Value in this Area
Purchase History
| Date | Buyer | Sale Price | Title Company |
|---|---|---|---|
| Rodriguez Francisco | -- | Inwest Title | |
| Clark And Robyn Van Buren Family Trust | -- | None Listed On Document | |
| Rodriguez Francisco | -- | First American | |
| Rodriguz Franciso N | -- | Advanced Title | |
| Rodriguez Franciso | -- | Advanced Title | |
| Rodriguez Francisco N | -- | Founders Title Company Syrac | |
| Rodriguez Francisco N | -- | Founders Title Company Syrac | |
| Hill Curtis L | -- | -- |
Source: Public Records
Mortgage History
| Date | Status | Borrower | Loan Amount |
|---|---|---|---|
| Open | Rodriguez Francisco | $519,000 | |
| Previous Owner | Rodriguez Francisco | $242,000 | |
| Previous Owner | Rodriguez Francisco N | $264,000 | |
| Previous Owner | Rodriguez Francisco N | $259,000 | |
| Previous Owner | Hill Curtis L | $200,000 |
Source: Public Records
Tax History
| Year | Tax Paid | Tax Assessment Tax Assessment Total Assessment is a certain percentage of the fair market value that is determined by local assessors to be the total taxable value of land and additions on the property. | Land | Improvement |
|---|---|---|---|---|
| 2025 | $4,211 | $752,007 | $202,365 | $549,642 |
| 2024 | $4,026 | $415,532 | $121,380 | $294,152 |
| 2023 | $4,249 | $433,218 | $113,002 | $320,216 |
| 2022 | $3,881 | $396,550 | $95,732 | $300,818 |
| 2021 | $3,238 | $556,011 | $151,235 | $404,776 |
| 2020 | $2,967 | $465,999 | $136,203 | $329,796 |
| 2019 | $3,076 | $457,001 | $136,243 | $320,758 |
| 2018 | $3,207 | $455,977 | $136,200 | $319,777 |
| 2017 | $2,833 | $392,000 | $98,400 | $293,600 |
| 2016 | $2,808 | $214,730 | $57,900 | $156,830 |
| 2015 | $2,489 | $188,012 | $38,650 | $149,362 |
| 2014 | $2,306 | $169,669 | $38,650 | $131,019 |
Source: Public Records
Map
Nearby Homes
- 5801 S 7100 W
- 5585 S 6950 W
- 6242 W 5950 S
- 6868 W 5100 S
- 5015 S 6700 W
- 0 W 5500 S
- 6014 W 5300 S
- 6036 W 4700 S
- 5957 W 4700 S
- 4100 S 5900 W
- 2084 N 4500 W
- 5335 W 5500 S
- 3729 S 5600 W Unit 6
- 3720 S 5600 W Unit 2
- 3732 S 5600 W Unit 3
- 3719 S 5600 W Unit 7
- 4396 W 1825 N Unit 112
- 4382 W 1825 N Unit 110
- 1156 N 5150 W
- 4348 W 1825 N Unit 103
Your Personal Tour Guide
Ask me questions while you tour the home.