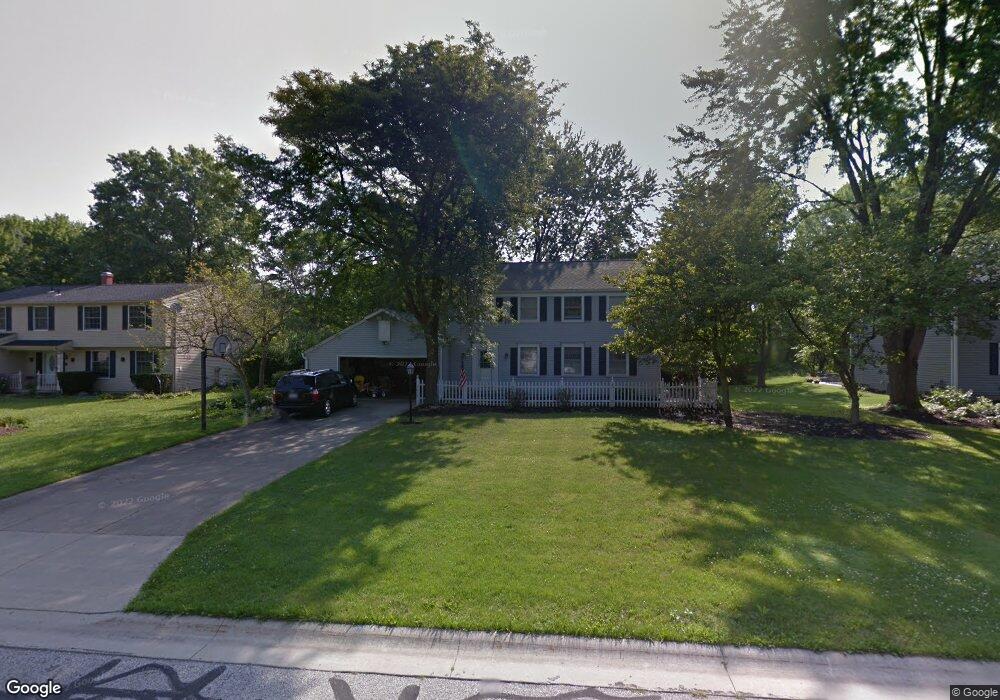
5879 Bradford Way Hudson, OH 44236
Estimated Value: $373,000 - $428,000
4
Beds
3
Baths
1,944
Sq Ft
$210/Sq Ft
Est. Value
About This Home
This home is located at 5879 Bradford Way, Hudson, OH 44236 and is currently estimated at $408,127, approximately $209 per square foot. 5879 Bradford Way is a home located in Summit County with nearby schools including Ellsworth Hill Elementary School, East Woods Intermediate School, and Hudson Middle School.
Ownership History
Date
Name
Owned For
Owner Type
Purchase Details
Closed on
Jun 15, 2008
Sold by
Cockerham Kevin L and Cockerham Kathleen O
Bought by
Peck Gina M
Current Estimated Value
Home Financials for this Owner
Home Financials are based on the most recent Mortgage that was taken out on this home.
Original Mortgage
$154,000
Interest Rate
6.66%
Mortgage Type
Purchase Money Mortgage
Purchase Details
Closed on
Jul 27, 1994
Sold by
Costello John P
Bought by
Cockerham Kevin L and Cockerham Kathleen O
Home Financials for this Owner
Home Financials are based on the most recent Mortgage that was taken out on this home.
Original Mortgage
$133,450
Interest Rate
4.99%
Mortgage Type
New Conventional
Create a Home Valuation Report for This Property
The Home Valuation Report is an in-depth analysis detailing your home's value as well as a comparison with similar homes in the area
Home Values in the Area
Average Home Value in this Area
Purchase History
| Date | Buyer | Sale Price | Title Company |
|---|---|---|---|
| Peck Gina M | $225,000 | Chicago Title Insurance Co | |
| Cockerham Kevin L | $157,000 | -- |
Source: Public Records
Mortgage History
| Date | Status | Borrower | Loan Amount |
|---|---|---|---|
| Previous Owner | Peck Gina M | $154,000 | |
| Previous Owner | Cockerham Kevin L | $133,450 |
Source: Public Records
Tax History Compared to Growth
Tax History
| Year | Tax Paid | Tax Assessment Tax Assessment Total Assessment is a certain percentage of the fair market value that is determined by local assessors to be the total taxable value of land and additions on the property. | Land | Improvement |
|---|---|---|---|---|
| 2025 | $5,725 | $109,466 | $19,131 | $90,335 |
| 2024 | $5,585 | $109,466 | $19,131 | $90,335 |
| 2023 | $5,725 | $109,466 | $19,131 | $90,335 |
| 2022 | $5,088 | $84,861 | $14,833 | $70,028 |
| 2021 | $4,865 | $84,861 | $14,833 | $70,028 |
| 2020 | $4,779 | $84,860 | $14,830 | $70,030 |
| 2019 | $4,473 | $73,470 | $14,830 | $58,640 |
| 2018 | $4,457 | $73,470 | $14,830 | $58,640 |
| 2017 | $3,912 | $73,470 | $14,830 | $58,640 |
| 2016 | $3,940 | $62,570 | $14,830 | $47,740 |
| 2015 | $3,912 | $62,570 | $14,830 | $47,740 |
| 2014 | $3,923 | $62,570 | $14,830 | $47,740 |
| 2013 | $3,894 | $60,660 | $14,830 | $45,830 |
Source: Public Records
Map
Nearby Homes
- 5937 Ogilby Dr
- 5791 Sunset Dr
- 5974 Anna Lee Dr
- 1705 Barlow Rd
- 148 Colony Dr
- 21 Keswick Dr
- 94 Fox Trace Ln
- 35 S Hayden Pkwy
- 5532 Hudson Dr
- 1620 Sapphire Dr
- 1759 E Sapphire Dr
- V/L Norton Rd
- 5139 Rockport Cove
- 21 Atterbury Blvd
- 1884 Village Ct Unit X66
- 6607 Dunbarton Dr
- V/L Lawnmark Dr
- 157 Hudson St
- 77 Atterbury Blvd Unit 106
- 6751 Pheasants Ridge
- 5869 Bradford Way
- 5889 Bradford Way
- 5859 Bradford Way
- 5906 Ogilby Dr
- 5896 Ogilby Dr
- 5916 Ogilby Dr
- 5880 Bradford Way
- 5870 Bradford Way
- 5890 Bradford Way
- 5886 Ogilby Dr
- 5926 Ogilby Dr
- 5849 Bradford Way
- 5909 Bradford Way
- 5860 Bradford Way
- 5900 Bradford Way
- 5876 Ogilby Dr
- 5936 Ogilby Dr
- 5850 Bradford Way
- 5919 Bradford Way
- 5893 Sunset Dr