Estimated Value: $341,000 - $379,000
3
Beds
1
Bath
1,100
Sq Ft
$324/Sq Ft
Est. Value
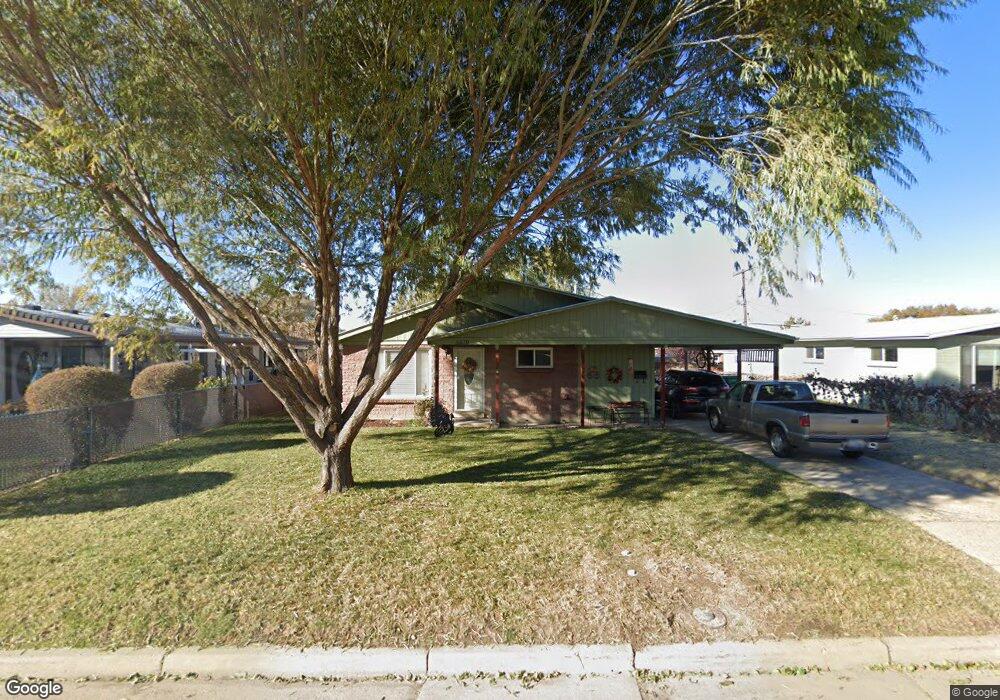
About This Home
This home is located at 5879 S 2575 W, Roy, UT 84067 and is currently estimated at $356,454, approximately $324 per square foot. 5879 S 2575 W is a home located in Weber County with nearby schools including Municipal School, Roy Junior High School, and Roy High School.
Ownership History
Date
Name
Owned For
Owner Type
Purchase Details
Closed on
Apr 3, 2012
Sold by
Castillo Luna Olga M and Castillo Olga M
Bought by
Luna Miguel R and Castillo Luna Olga M
Current Estimated Value
Home Financials for this Owner
Home Financials are based on the most recent Mortgage that was taken out on this home.
Original Mortgage
$83,600
Outstanding Balance
$57,552
Interest Rate
3.84%
Mortgage Type
New Conventional
Estimated Equity
$298,902
Purchase Details
Closed on
Jun 16, 2004
Sold by
Tucker Jared L and Tucker Celeste
Bought by
Castillo Olga M
Purchase Details
Closed on
Dec 29, 1999
Sold by
Bermejo Jose Luis
Bought by
Tucker Jared L and Tucker Celeste
Home Financials for this Owner
Home Financials are based on the most recent Mortgage that was taken out on this home.
Original Mortgage
$92,735
Interest Rate
7.68%
Mortgage Type
FHA
Create a Home Valuation Report for This Property
The Home Valuation Report is an in-depth analysis detailing your home's value as well as a comparison with similar homes in the area
Home Values in the Area
Average Home Value in this Area
Purchase History
| Date | Buyer | Sale Price | Title Company |
|---|---|---|---|
| Luna Miguel R | -- | Lsi Title Insurance Agency O | |
| Castillo Olga M | -- | Mountain View Title Ogden | |
| Tucker Jared L | -- | Associated Title |
Source: Public Records
Mortgage History
| Date | Status | Borrower | Loan Amount |
|---|---|---|---|
| Open | Luna Miguel R | $83,600 | |
| Previous Owner | Tucker Jared L | $92,735 |
Source: Public Records
Tax History
| Year | Tax Paid | Tax Assessment Tax Assessment Total Assessment is a certain percentage of the fair market value that is determined by local assessors to be the total taxable value of land and additions on the property. | Land | Improvement |
|---|---|---|---|---|
| 2025 | $2,035 | $312,209 | $104,276 | $207,933 |
| 2024 | $1,970 | $167,199 | $57,360 | $109,839 |
| 2023 | $1,835 | $155,100 | $56,189 | $98,911 |
| 2022 | $2,076 | $184,250 | $53,042 | $131,208 |
| 2021 | $1,574 | $226,000 | $62,435 | $163,565 |
| 2020 | $1,485 | $196,000 | $62,435 | $133,565 |
| 2019 | $1,449 | $180,000 | $37,944 | $142,056 |
| 2018 | $1,102 | $149,000 | $33,111 | $115,889 |
| 2017 | $989 | $126,000 | $33,111 | $92,889 |
| 2016 | $934 | $64,153 | $18,467 | $45,686 |
| 2015 | $794 | $56,235 | $21,130 | $35,105 |
| 2014 | $775 | $54,228 | $15,781 | $38,447 |
Source: Public Records
Map
Nearby Homes
Your Personal Tour Guide
Ask me questions while you tour the home.