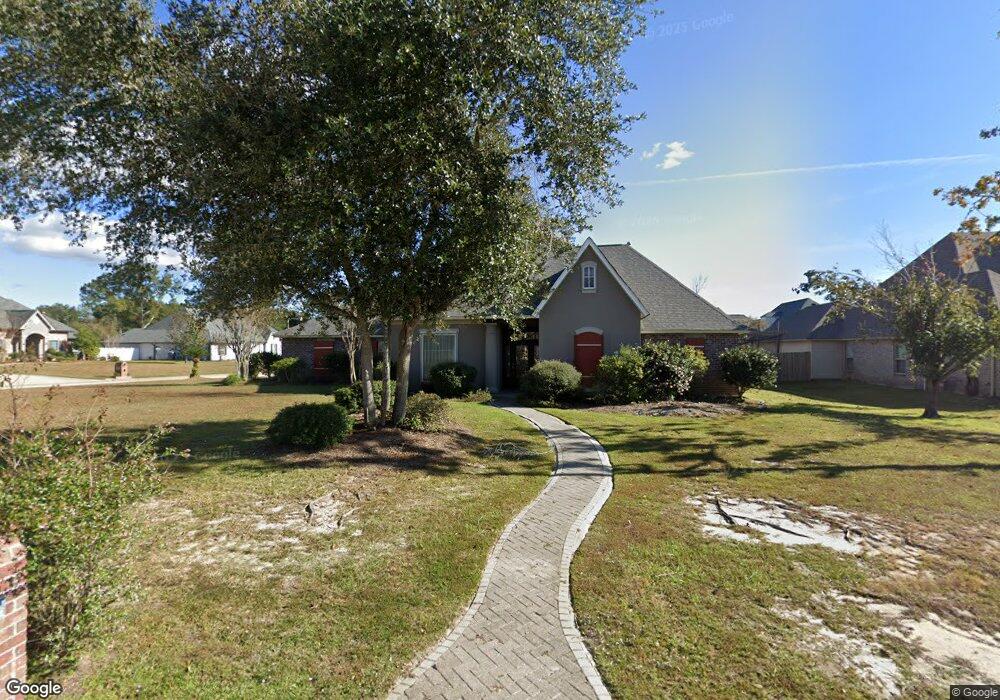
588 Clayton Ct Slidell, LA 70461
Estimated Value: $497,000 - $533,000
4
Beds
4
Baths
3,087
Sq Ft
$166/Sq Ft
Est. Value
About This Home
This home is located at 588 Clayton Ct, Slidell, LA 70461 and is currently estimated at $513,416, approximately $166 per square foot. 588 Clayton Ct is a home located in St. Tammany Parish with nearby schools including Cypress Cove Elementary School, Honey Island Elementary School, and Little Oak Middle School.
Ownership History
Date
Name
Owned For
Owner Type
Purchase Details
Closed on
Jan 9, 2008
Sold by
Romano Joyce Schwab and Romano Gary D
Bought by
Mistrot Cynthia Schumacher and Mistrot Ronald William
Current Estimated Value
Home Financials for this Owner
Home Financials are based on the most recent Mortgage that was taken out on this home.
Original Mortgage
$300,000
Interest Rate
6.11%
Mortgage Type
New Conventional
Create a Home Valuation Report for This Property
The Home Valuation Report is an in-depth analysis detailing your home's value as well as a comparison with similar homes in the area
Home Values in the Area
Average Home Value in this Area
Purchase History
| Date | Buyer | Sale Price | Title Company |
|---|---|---|---|
| Mistrot Cynthia Schumacher | $415,000 | None Available |
Source: Public Records
Mortgage History
| Date | Status | Borrower | Loan Amount |
|---|---|---|---|
| Closed | Mistrot Cynthia Schumacher | $300,000 |
Source: Public Records
Tax History Compared to Growth
Tax History
| Year | Tax Paid | Tax Assessment Tax Assessment Total Assessment is a certain percentage of the fair market value that is determined by local assessors to be the total taxable value of land and additions on the property. | Land | Improvement |
|---|---|---|---|---|
| 2024 | $5,087 | $43,671 | $7,931 | $35,740 |
| 2023 | $5,292 | $35,139 | $7,931 | $27,208 |
| 2022 | $452,197 | $35,139 | $7,931 | $27,208 |
| 2021 | $4,516 | $35,139 | $7,931 | $27,208 |
| 2020 | $4,492 | $35,139 | $7,931 | $27,208 |
| 2019 | $5,058 | $34,116 | $7,700 | $26,416 |
| 2018 | $5,077 | $34,116 | $7,700 | $26,416 |
| 2017 | $5,111 | $34,116 | $7,700 | $26,416 |
| 2016 | $5,231 | $34,116 | $7,700 | $26,416 |
| 2015 | $3,722 | $31,161 | $5,000 | $26,161 |
| 2014 | $3,677 | $31,161 | $5,000 | $26,161 |
| 2013 | -- | $31,161 | $5,000 | $26,161 |
Source: Public Records
Map
Nearby Homes